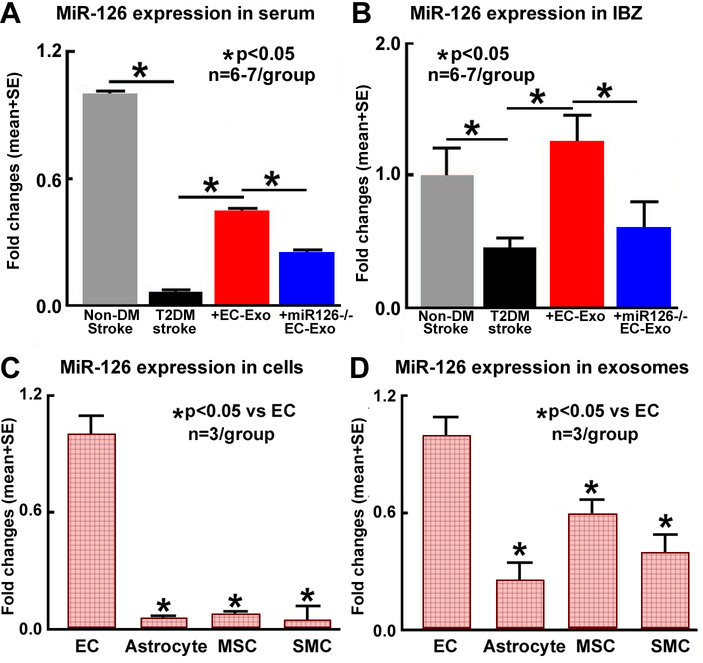
Figure 1. MiR-126 measurement in vivo and in vitro.
(A-B) Compared to non-DM stroke mice, T2DM-stroke mice exhibit significantly decreased serum and brain tissue miR-126 expression. Treatment of T2DM-stroke mice with EC-Exo significantly increases serum and brain tissue miR-126 expression. Loss of miR-126 in EC-Exo attanuates EC-Exo induced increase in seruma nd brain miR-126 expression. (C-D) ECs and EC-Exo contain high levels of miR-126 compared to other cell types or exosomes derived from other types of cells, respectively.

