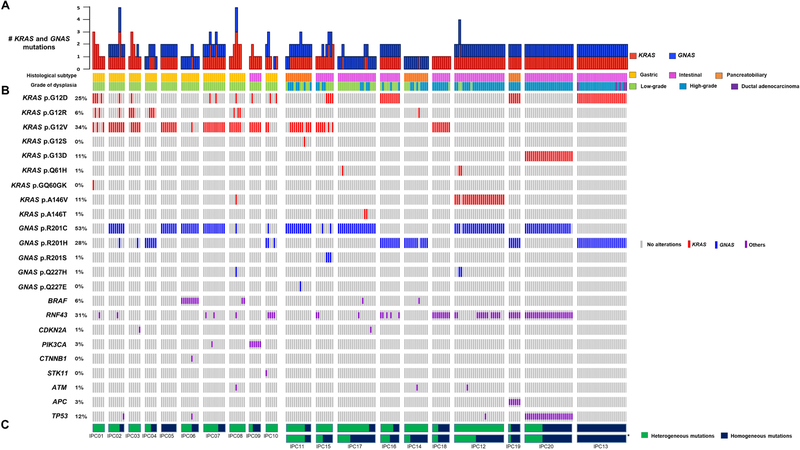
Figure 1. Landscape of somatic driver gene mutations in IPMNs.
Integrated genomic data for 227 samples (bars) from 20 IPMNs (columns). The histologic subtype and grade of dysplasia data for each sample are shown as tracks at the top. IPMNs are grouped by grade of dysplasia with low-grade on the left and high-grade on the right. A. Bar plot representing the total number of KRAS and GNAS mutations per sample. B. Oncoprint heatmap depicting mutations occurring in KRAS, GNAS, or others (see color legend) or absence (gray bar). Single-nucleotide variants are listed for KRAS and GNAS, all other mutations are grouped by gene (rows). The percentage of samples with a given mutation is noted at the left. C. Proportion of heterogeneous mutations (green) and homogeneous mutations (blue) in each IPMN. *For mixed-grade IPMNs, the proportion of heterogeneous and homogenous mutations was recalculated after excluding low-grade samples (high-grade only).

