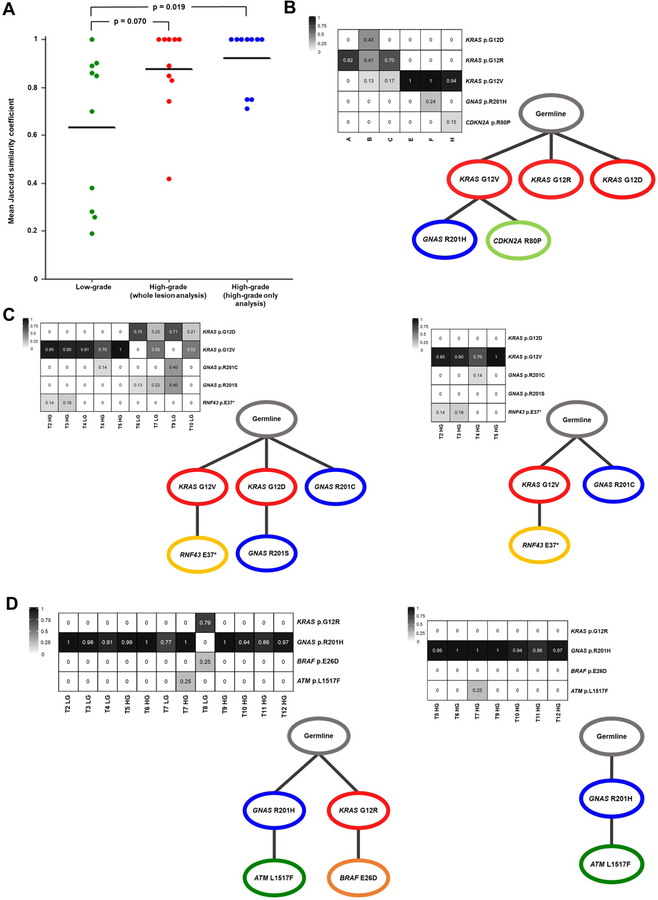
Figure 2. Early driver gene heterogeneity and polyclonal origin of IPMNs.
A. Dot plot of the average Jaccard similarity coefficient for each case based on KRAS and GNAS mutations only. Low-grade IPMNs are significantly more heterogeneous than high-grade IPMNs via whole lesion analysis (p value = 0.070; Mann-Whitney U test) and high-grade IPMNs via high-grade only analysis (p value = 0.019; Mann-Whitney U test). B-D. Neoplastic cancer cell fractions (NCFs) are presented in heat maps with each row representing a mutation and each column representing a region or sample. Each NCF heat map corresponds to a schematic of tumor evolution – SCHISM was used to reconstruct somatic mutation hierarchy trees. B. Low-grade IPMN, IPC03. C. Whole lesion analysis (left) or high-grade only analysis (right) of IPC15. D. Whole lesion analysis (left) or high-grade only analysis (right) of IPC14.

