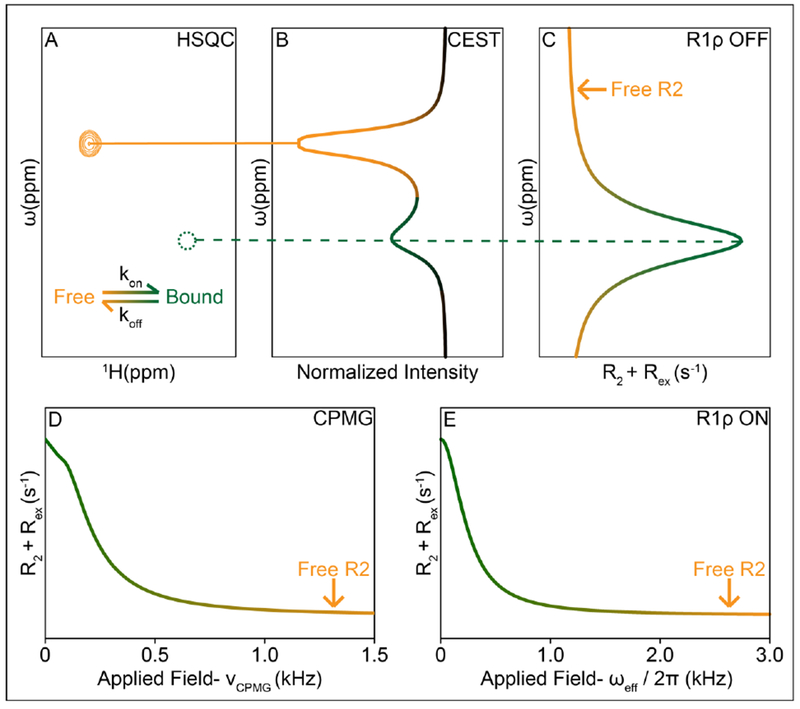
Figure 5. NMR relaxation dispersion techniques for measuring ligand-binding kinetics.

(A) HSQC of free and bound states undergoing exchange, green may be an NMR invisible state, undetectable in the HSQC. (B) Simulated CEST curve shows a major state dip at the location of the free state, and a smaller dip at the bound state (C) Simulated R1ρ off-resonance curve shows a peak indicating higher R2 values at the location of the bound state, while the free state is evident in the R2 limits of the plot. (D) CPMG and (E) R1ρ on-resonance curves show an increase in R2 due to exchange with the bound state.
