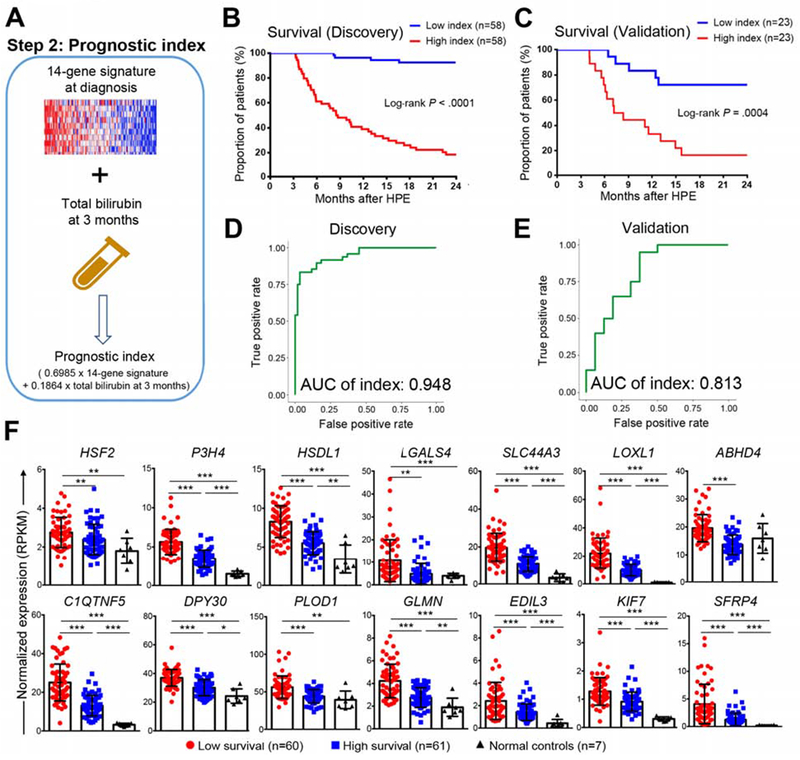
Figure 2. Prognostic index of 2-year survival with the native liver.

Panel A shows a strategy that combines the 14-gene signature and serum total bilirubin at 3 months after hepatoportoenterostomy to generate a prognostic index. Kaplan-Meier plots in B and C dichotomizes the cohort into groups of high or low survival based on prognostic index for individual patients. Log-rank test was used to compare the survival distributions of two groups. In D and E, ROC curves generated by the prognostic index at 2 years of age for D discovery and E validation cohorts. AUC of index is shown. In panel F, boxplots of expression levels of 14 genes in the low and high survival groups in discovery cohort and normal controls group. Expression levels are represented as mean ± SD of normalized expression (RPKM value). P value was calculated by Wilcoxon rank sum test. *P < 0.05, **P < 0.01, ***P < 0.001.
