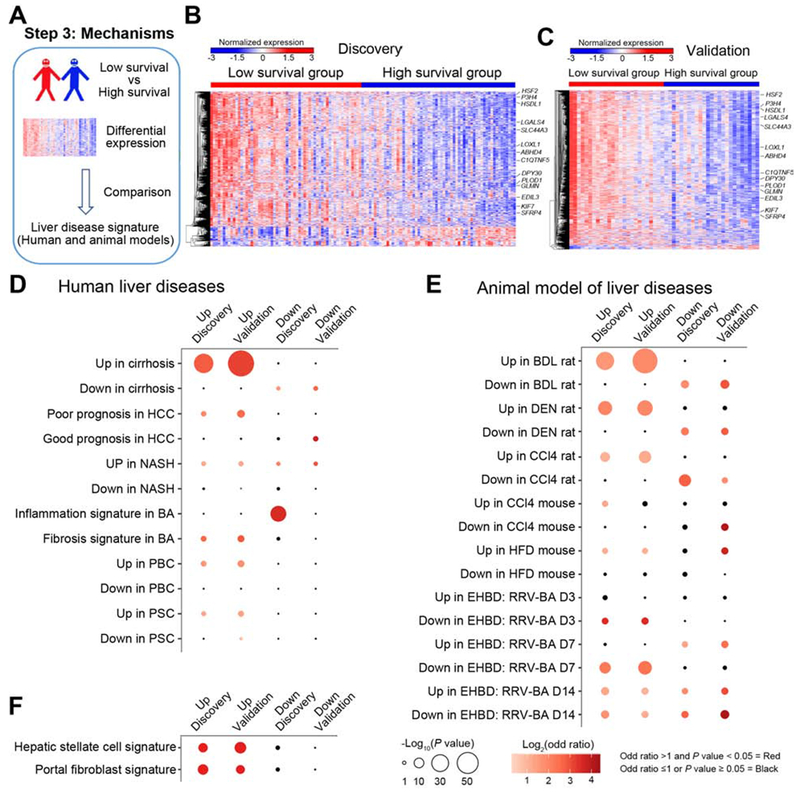
Figure 3. Low survival group exhibits a prominent gene signatures of cirrhosis.

Panel A shows the use of differentially expressed genes between high and low survival groups compared with signatures of other liver diseases and animal models. The expression heatmaps of differentially expressed genes are shown for the discovery (B) and validation (C) cohorts (levels of gene expression are shown as color variation from red [high] to blue [low], with Euclidean distance used in hierarchical clustering). 14 genes are identified in the heatmaps. Pairwise overlapping comparisons were performed between upregulated or downregulated genes with gene signatures of human liver diseases (shown in D), animal models of human liver diseases (E), and hepatic stellate cells and portal fibroblasts (F). Overlaps were examined by Fisher’s exact test and shown as dots whose size is proportional to −log10(P value) and gradation of red is proportional to log2(odd ratio). Overlaps with −log10(P value) >1.3 and log2(odd ratio) >0 were defined as significant overlaps and are shown in red; the color black depicts overlaps with odds ratio ≤1 or P value > 0.05.
