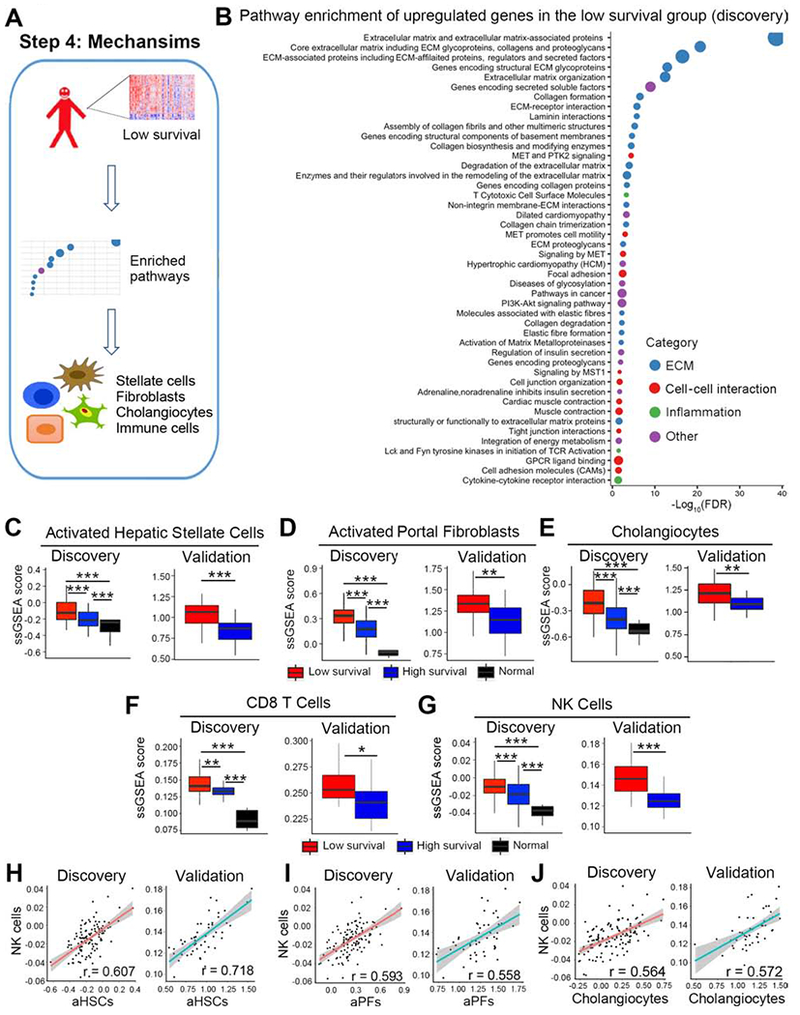
Figure 4. Extracellular matrix formation related gene signature and cellular source, CD8T and NK cells are enriched in the low survival group.

Panel A shows an analytic pipeline identifying enriched pathways and cell types in the low survival group and the quantification of the relative abundance of individual cell types. Dotplot shown in B depicts pathways that are enriched in upregulated genes of the low survival group in the discovery cohort. Pathway terms were ranked according to their −log10(FDR) values and categorized into extracellular matrix (ECM), cell-cell interaction, inflammation and other. The dot sizes are proportional to number of genes. For panels C-G, boxplots show enrichment of activated hepatic stellate cells (aHSC, C), activated portal fibroblasts (aPFs, D), cholangiocytes (E), CD8 T cells (F), and NK cells (G). Enrichments are represented as mean ± SD of ssGSEA scores. P value was calculated by Wilcoxon rank sum test. Scatterplots shown in H-J represent linear correlation between NK cells and aHSCs, aPFs, and cholangiocytes. Pearson correlation coefficient r is shown, with the grey area representing 95% confidence limits. *P < 0.05, **P < 0.01, ***P < 0.001.
