
Fig. 1.
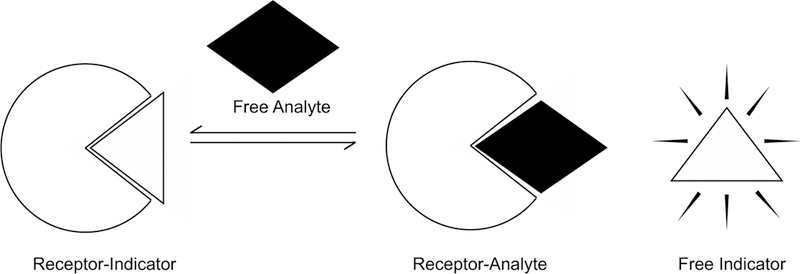
Schematic of an indicator displacement assay. In this example, optical signal intensity is low when the indicator is bound to the receptor and high when the indicator is free in solution.
Official websites use .gov
A
.gov website belongs to an official
government organization in the United States.
Secure .gov websites use HTTPS
A lock (
) or https:// means you've safely
connected to the .gov website. Share sensitive
information only on official, secure websites.
Schematic of an indicator displacement assay. In this example, optical signal intensity is low when the indicator is bound to the receptor and high when the indicator is free in solution.