
Figure 1. Taxonomic and community-level changes between NAFLD versus controls.
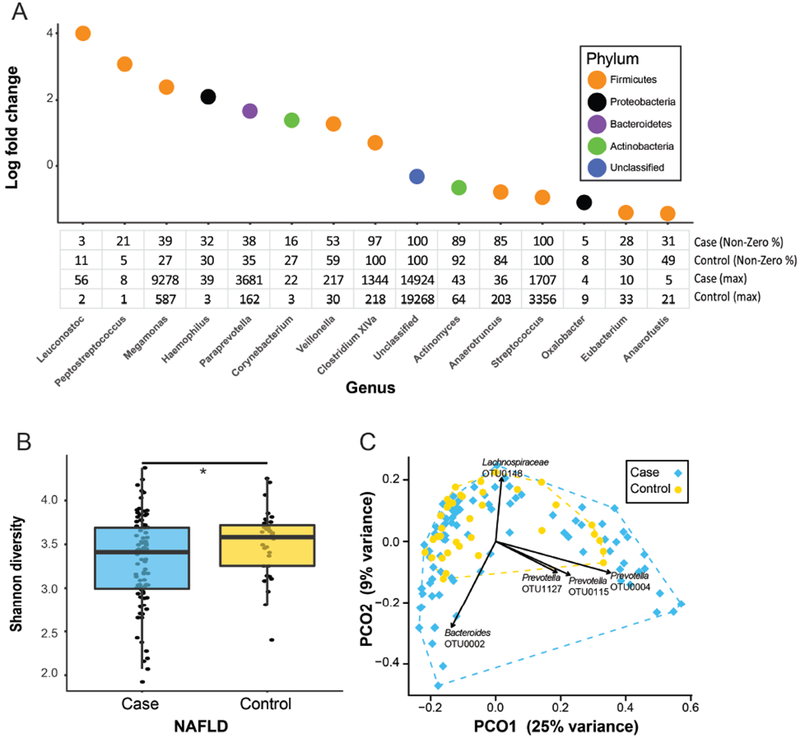
(A) Bacterial genera identified as being differentially abundant when comparing cases to controls and accounting for ethnicity. The table shows percentage of individuals with non-zero read counts for each genus and maximum number of reads detected in any single individual following normalization. (B) Difference in α-diversity between cases and controls (*p<0.05). (C) Principal coordinates analysis (PCoA) plot showing variation in β-diversity between cases and controls. Each point represents a single patient. Overlaid vectors indicate the direction of change in abundance for top five OTUs correlating with distribution of individuals within the plot.