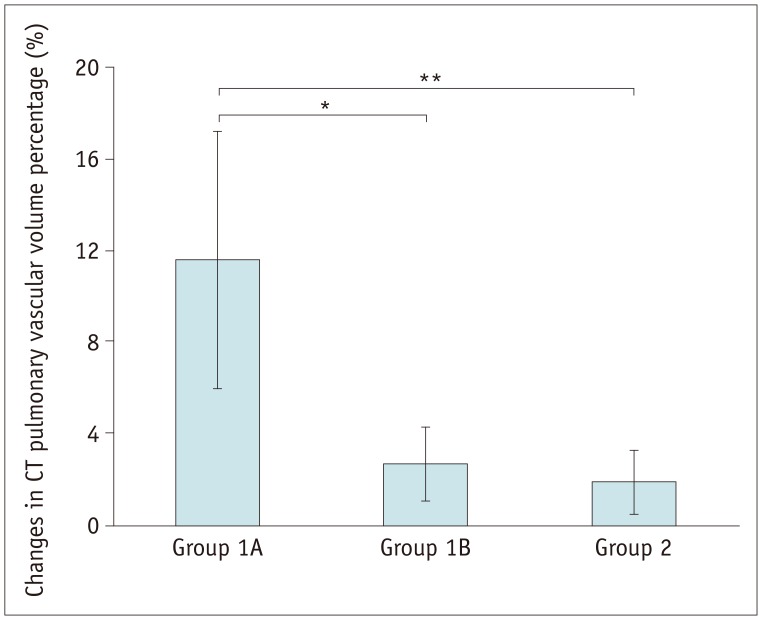
Fig. 1. Bar graph demonstrating changes in CT pulmonary vascular volume percentages on serial cardiothoracic CT examinations among groups 1A, 1B, and 2.
Changes in CT pulmonary vascular volume percentages in group 1A are statistically significantly greater than those in group 1B (11.6 ± 5.6% vs. 2.7 ± 1.6%, p < 0.003 [*]) and group 2 (11.6 ± 5.6% vs. 1.9 ± 1.4%, p < 0.002 [**]), while no statistically significant difference was found between group 1B and group 2 (2.7 ± 1.6% vs. 1.9 ± 1.4%, p > 0.1). CT = computed tomography

