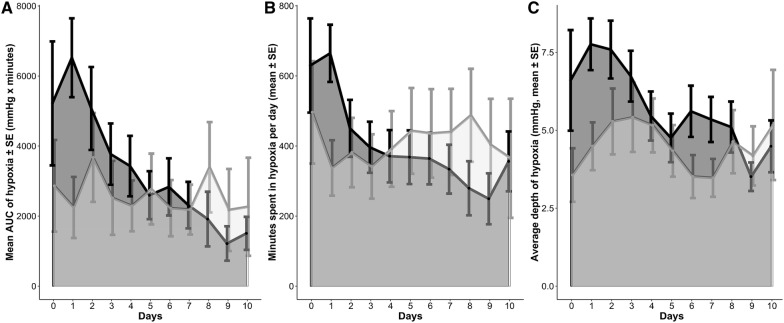
Fig. 5.
Brain tissue hypoxia (PbtO2 < 20 mmHg) burden at each site based on PbtO2 mean values of 5-min intervals. a The daily brain tissue hypoxia burden, defined as the mean (± SEM) area under the curve of brain tissue hypoxia (= sum of depth of abnormalities multiplied by the time spent in PbtO2 < 20 mmHg normalized to monitored time) is reported in mmHg*minutes. NICU 1 is represented by the darker shades of gray, NICU 2 by the lighter shades of gray. b Time spent in brain tissue hypoxia expressed in daily mean (± SEM) minutes (normalized to monitored time). NICU 1 is represented by the darker shades of gray, NICU 2 by the lighter shades of gray. c Average depth of brain tissue hypoxia (the mean (± SEM) of the PbtO2 values < 20 mmHg normalized to monitoring time). NICU 1 is represented by the darker shades of gray, NICU 2 by the lighter shades of gray

