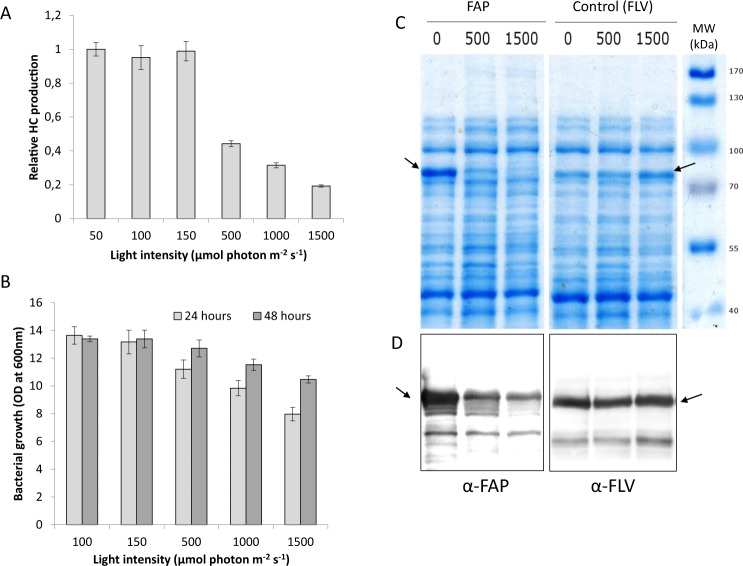
Figure 1.
Influence of light intensity on HC production, bacterial growth and level of soluble FAP in a FAP-expressing E. coli strain. Strains were grown in batch culture under various light intensities. Data represent the mean ± SD of three independent experiments using three different bacterial cultures. (A) Relative HC production measured in cells 48 hours after induction. Production per culture volume was normalized by maximum obtained. (B) Growth of the culture measured by optical density (OD) at 600 nm, 24 hours or 48 hours post-induction. (C) SDS-PAGE of soluble proteins extracted from an E. coli strain expressing the FAP or a control strain expressing another flavoprotein (flavodiiron protein, FLV). 0, 500 and 1500 correspond to light intensities in µmol photons m2 s−1. Equal protein amounts were loaded in each lane. Bands of FAP and FLV are indicated by arrows. (D) Western blot of the SDS-PAGE revealed with anti-FAP or anti-FLV antibodies. Full-length gel and blots are included as Supplemental Fig. 2.

