Figure 1.
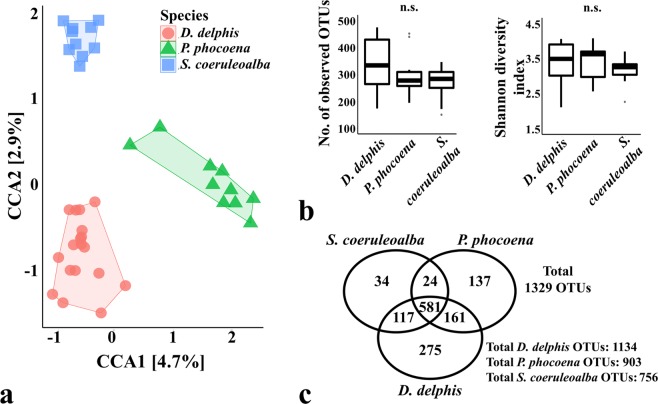
Comparison of the oral microbiomes of cetaceans according to the species of the sampled animals. Panel (a) shows the Canonical Correspondence Analysis (CCA) (p-value = 0.001) which was performed after subsampling the OTU table to even sequencing depth and at the bacterial species level, with Hellinger transformation of the abundances. Similar results were obtained when grouping the OTUs by bacterial genera. The colour frames in both CCA plots group the samples according to the constrained variable. The major contributions of the “host species” variable are shown as % in the first and second component of the CCA plot (CCA1 and CCA2, respectively). Panel (b) shows the richness and diversity measures calculated between species (as the average observed OTUs and Shannon diversity index of each sample), using the OTU table normalized by total sum scaling. Significance of these alpha-diversity metrics was tested with Kruskal-Wallis chi-squared test followed by pairwise Wilcoxon test between groups (n.s, statistically not significant). Panel c shows the number of total OTUs in each group and the number of OTUs shared between groups. Delphinus delphis (n = 18), Phocoena phocoena (n = 10) and Stenella coeruleoalba (n = 10).

