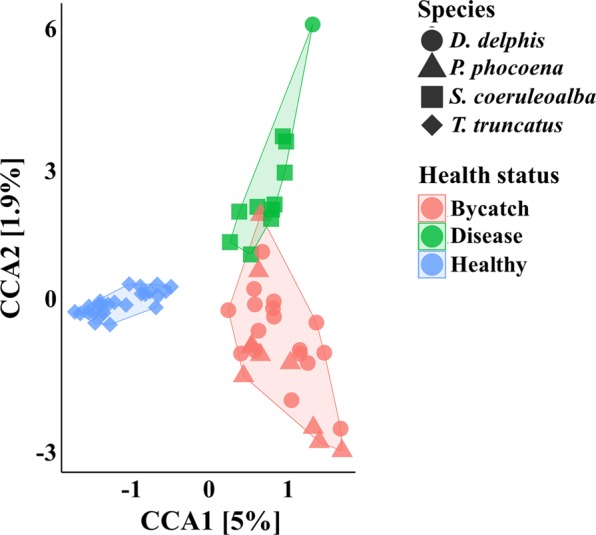
Figure 5.

CCA of the oral microbiomes of the 4 cetacean species, according to their health status. Canonical Correspondance Analysis of the oral microbial communities of cetaceans sampled in this study and by Bik et al.17, constrained according to the health status of the sampled animals (p-value = 0.001). The color frames in the plot group the samples according to the constrained variable, comprising 3 groups: dead animals derived from bycatch (n = 27), stranded diseased animals (n = 11) and healthy animals sampled by capture and release procedure (n = 25) in Bik et al.17. Both ordinations were performed after subsampling the OTU tables to even sequencing depth of 1019 sequences and at the genus level, with Hellinger transformation of the abundances. In both panels, the species of the sampled animals are represented by symbols: D. delphis (●), P. phocoena (▲) or S. coeruleoalba (■) or T. truncatus (♦). The major contributions of the “health status” variable are shown as % in the first and second component of the CCA plot (CCA1 and CCA2, respectively).
