Fig. 2.
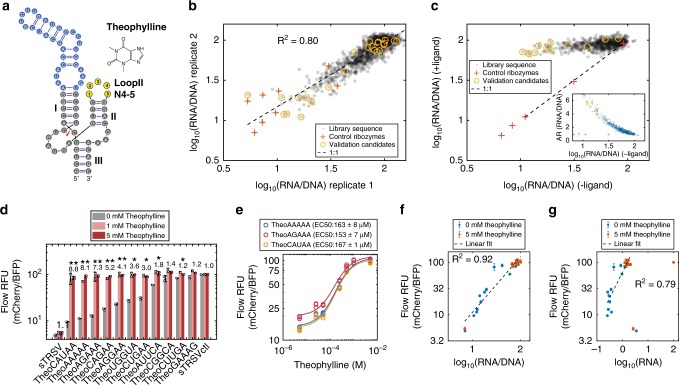
RNA-Seq assay for a theophylline ribozyme switch library. a Illustration of a theophylline ribozyme switch library design. b Normalized RNA read counts from replicate RNA-Seq experiments (R2 = 0.80). Each dot represents a unique sequence with over 100 sequencing read counts in an experiment (665 sequences). Pluses are spiked-in control ribozymes; circles indicate sequences selected for validation. c Normalized RNA read counts from an RNA-Seq assay performed on a theophylline ribozyme switch library in the absence and presence of ligand. The inset shows the activation ratio (AR) as a function of normalized RNA read counts in the absence of ligand. −/+ Ligand conditions are 0/5 mM theophylline. d Flow cytometry analysis of individual members in the theophylline ribozyme switch library. Activation ratio (AR) of mCherry/BFP at the higher ligand concentration is indicated above each set of bars. sTRSV is the wild-type hammerhead ribozyme; sTRSVctl is a non-cleaving mutant of sTRSV; error bars indicate standard deviation of two biological replicates; asterisks indicate the Benjamini–Hochberg corrected p-values of switching significance between 0 and 5 mM theophylline, using p-values from unpaired, one-tailed t-test, *p < 0.01, **p < 0.001. Filled circles are individual replicate data points. e Dose response curves for three theophylline switches showing relative fluorescence values as a function of theophylline concentration. EC50 values are reported as mean ± standard deviation of three biological replicates. f Relative fluorescence values from flow cytometry analysis of individual sequences plotted against normalized RNA read counts from an RNA-Seq assay (R2 = 0.92). Error bars indicate standard deviation of two biological replicates. g Relative fluorescence values from flow cytometry analysis of individual sequences plotted against unnormalized RNA read counts from an RNA-Seq assay (R2 = 0.78). Error bars indicate standard deviation of two biological replicates. Outliers are spiked-in control ribozymes sTRSV and sTRSVctl. a, c, d All R2 are based on log10 transformed values. Source data are available in the Source Data file

