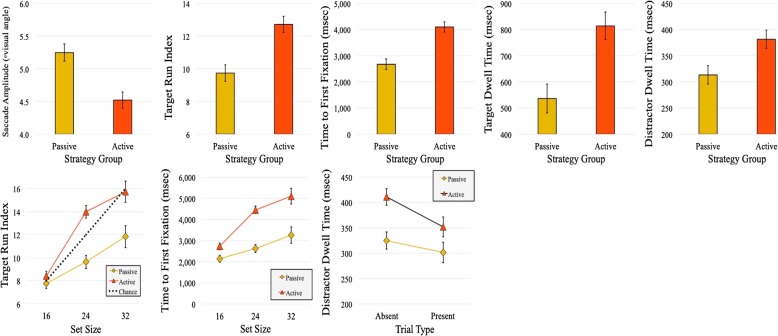
Fig. 5.
Significant main effects and interactions with strategy, from experiment 2, eye-trackings measures. The top row presents all main effects, and the bottom row presents all two-way interactions. The dotted line in the plot of target run index indicates the number of items that would be expected to be fixated upon due to chance alone, if no attentional guidance was present. Error bars represent one standard error of the mean (SEM)

