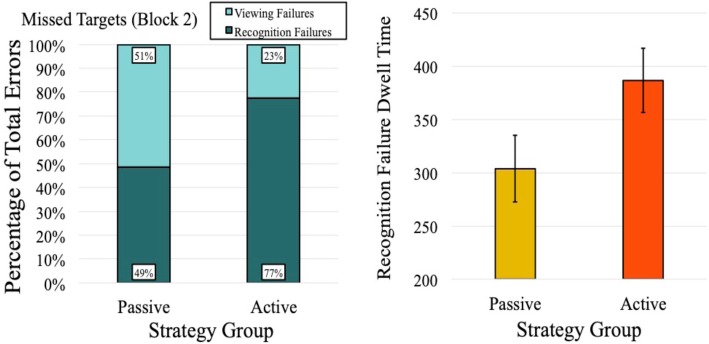
Fig. 6.
Examination of target misses from experiment 2, derived via eye tracking. The left panel shows the distribution of viewing to recognition failures (across strategy groups). Note that the figure shows proportion of error types, not overall error rates (which varied across groups and were higher for passive searchers). The right panel shows target dwell times when recognition failures occurred. Error bars represent one standard error of the mean (SEM)

