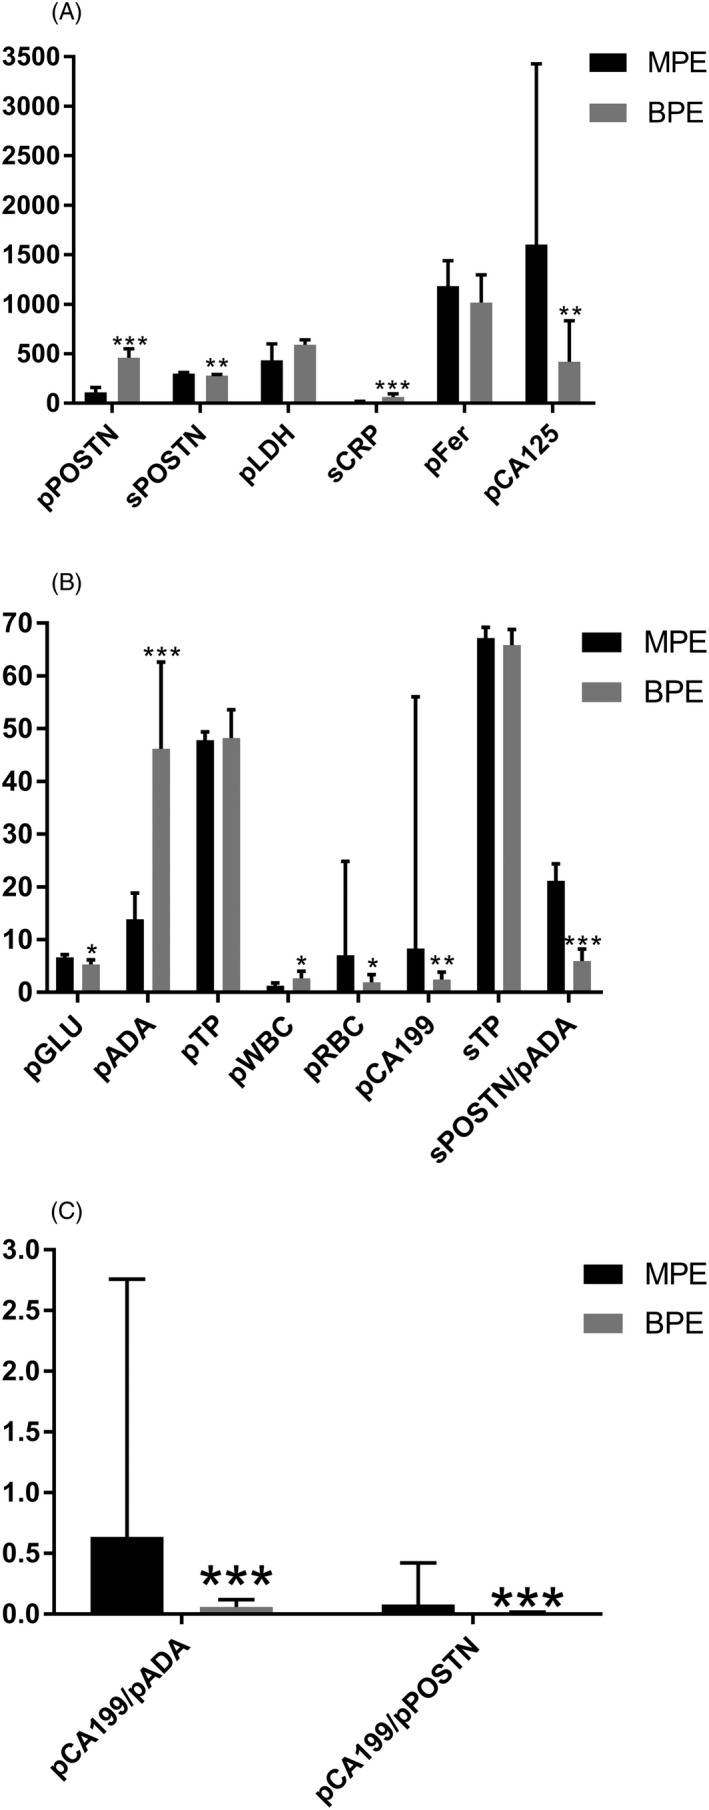
Figure 1.

Comparison of the parameters in pleural effusion from the two groups. A, The sPOSTN and pCA125 levels in the MPE group were obviously higher than those in the BPE group. The pPOSTN and sCRP levels in the MPE group were obviously lower than the BPE group. B, The pGLU, pRBC, pCA199, and sPOSTN/pADA levels in the MPE group was higher than those in the BPE group. The pADA and pWBC levels in the MPE group were obviously lower than those in the BPE group. C, The pCA199/pADA and pCA199/pPOSTN levels in the MPE group were obviously higher than those in the BPE group. *P < 0.5, **P < 0.01, and ***P < 0.001
