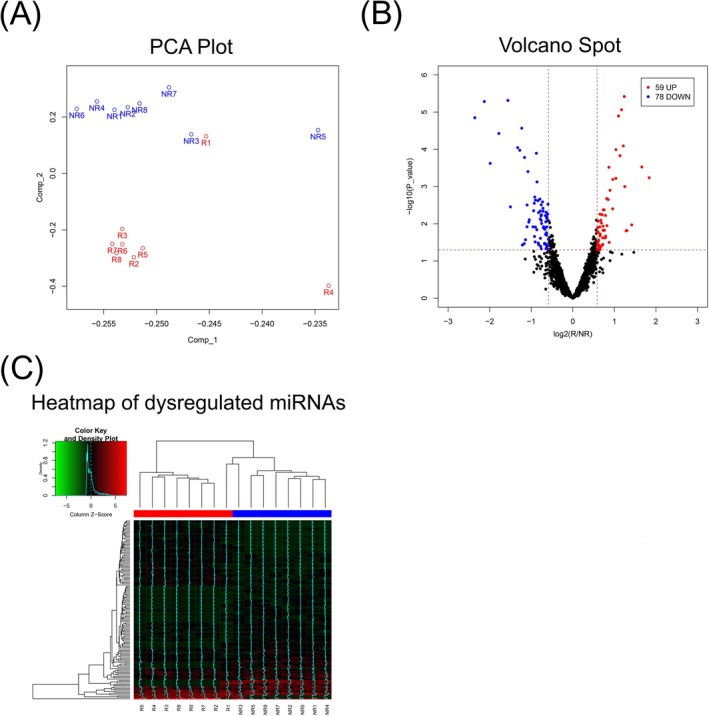
Figure 1.

Microarray data analysis. PCA plot of miRNA expression profile between responders (R) and non‐responders (NR) (A). Volcano plot of miRNA expression profile between responders and non‐responders (upregulated miRNAs represent with red plots; downregulated miRNAs represent with blue plots; non‐changed miRNAs represent with black plots) (B). Heatmap of dysregulated miRNAs between responders (R) and non‐responders (NR) (C)
