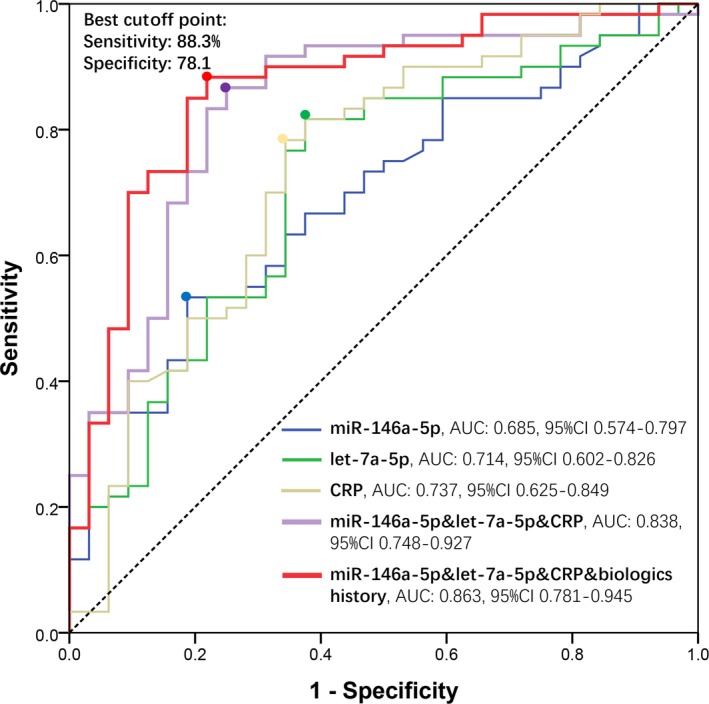
Figure 4.

ROC curve analysis for predicting clinical response. Predictive values of miR‐146a‐5p (blue line), let‐7a‐tp (green line), and CRP (yellow line); combination of miR‐146a‐5p, let‐7a‐tp, and CRP (purple line); and combination of miR‐146a‐5p, let‐7a‐5p, CRP, and biologics history (red line) for clinical response to TNF inhibitor
