Fig. 1.
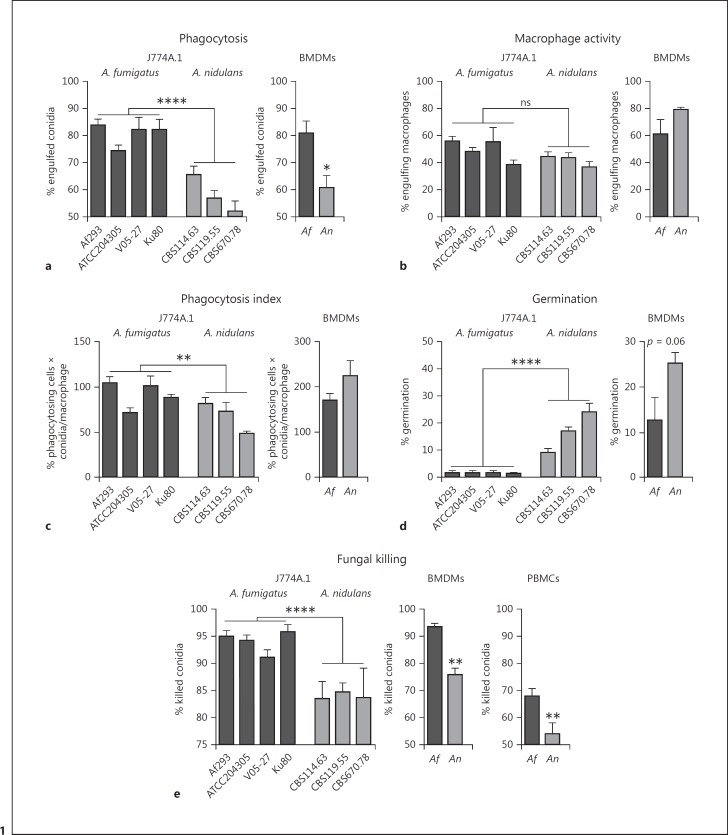
Comparison of phagocytosis and killing of A. fumigatus and A. nidulans by J774A.1 murine cells and BMDMs. a Percentage of engulfed live resting A. fumigatus (Af293, ATCC204305, V05–27, and Ku80) and A. nidulans (CBS114.63, CBS119.55, and CBS670.78) conidia after 6 h of exposure to J774A.1 cells or A. fumigatus (Af293) and A. nidulans (CBS114.63) in M-CSF-differentiated BMDMs at an MOI of 1:1. b Percentage of J774A.1 cells or BMDMs with engulfed conidia after 6 h. c Phagocytic index as calculated by the percentage of phagocytosing cells multiplied by the number of conidia per J774A.1 cell or BMDM. d Percentage of germinating conidia within the total population of conidia after 6 h of exposure to J774A.1 cells or BMDMs. e Percentage of conidia killed after 6 h of exposure to J774A.1 cells, BMDMs, or human PBMCs measured by CFUs remaining after plating on Sabouraud agar. Data are presented as the mean ± SEM derived from at least 4 independent experiments for J774A.1 cells with a total of 14 frames for Af293, 6 for V05–27, 6 for ATCC204305, 6 for Ku80, 14 for CBS114.63, 6 for CBS119.55, and 6 for CBS670.78. For BMDMs, 2 independent experiments are shown with 2 and 4 videos. Means were compared for significance using the Mann-Whitney U test; * p < 0.05, **p < 0.01, ****p < 0.0001.

