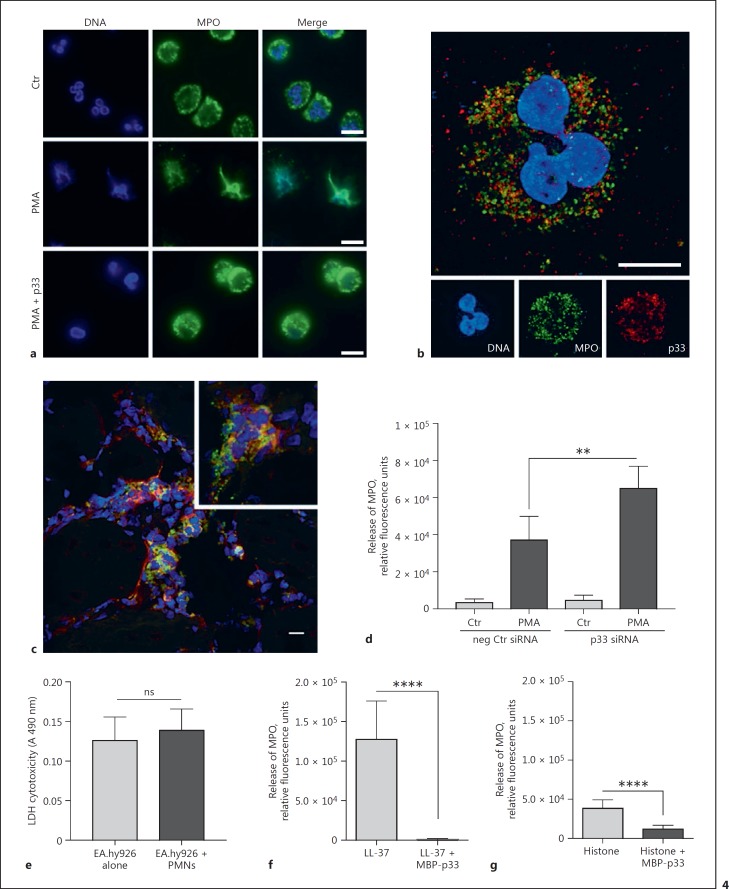
Fig. 4.
In infected tissue, p33 co-localises with MPO and dampens its release. a Representative fluorescence images of neutrophils treated with 25 nM PMA +/- 100 µg/mL p33. DAPI, blue; MPO, green. Scale bar, 10 µm. b Representative super-resolution micrograph of p33 (100 µg/mL) with endogenous neutrophil MPO. MPO, green; p33, red; DAPI, blue. Scale bar, 5 µm. c Snap-frozen tissue from a patient with necrotising fasciitis caused by an emm1 S. pyogenes strain was immunostained and assessed for the expression of MPO (green) and p33 (red). Yellow signal indicates co-localisation of p33 and MPO, as shown in the inset. The tissue was counterstained with DAPI to visualise cell nuclei (blue). Scale bar, 20 μm. d Effect of siRNA down-regulation of p33 in EA.hy926 cells on MPO release from PMNs after 3 h co-incubation. e Lactate dehydrogenase (LDH) assay of 3 h of endothelial cell-PMN co-incubation. ns, not significant. f, g Measurement of MPO release from PMNs after treatment with 5 µM LL-37 or 50 µg/mL CTHs +/- 333.3 or 100 µg/mL p33, respectively. Data is from 3 independent experiments; unpaired one-tailed Student t test +/- SEM. ** p ≤ 0.01, **** p ≤ 0.0001.

