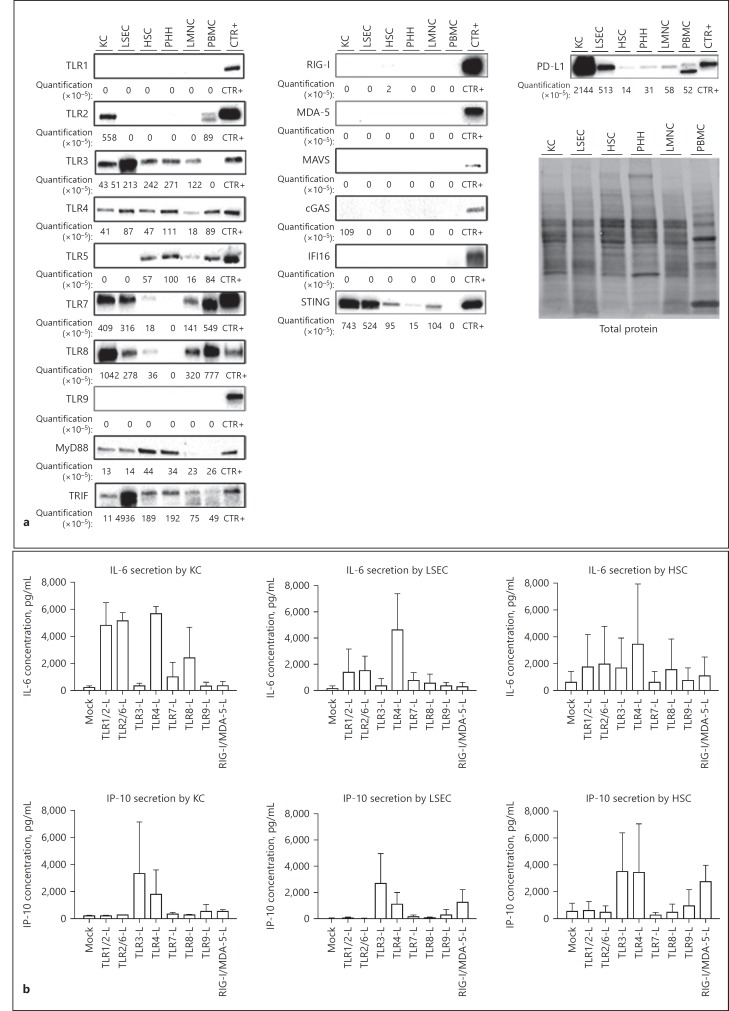
Fig. 2.
TLR, RLR, cytosolic DNA sensors and PD-L1 expression in nonstimulated primary liver resident cells and in responses to PRR stimulations. a PHH, LSEC, HSC, KC, LMNC, and PBMC were purified from at least 3 different donors and cultured for 24 h. Proteins were extracted, pooled, and TLR1 to TLR9, MyD88, TRIF, RIG-I, MDA-5, MAVS, cGAS, IFI16, STING, and PD-L1 protein expression was assessed by Western blot analysis. Target protein levels were normalized to total protein quantification assessed by stain-free gels. Stimulated cells were used as controls (CTR+) for primary antibody efficiencies as indicated in Table S2. b KC, LSEC, and HSC from different donors were exposed to the indicated ligands at the concentration indicated in online supplementary Table S3 for 24 h. Supernatants were collected, and IL-6 and IP-10 secretions were analyzed by ELISA. Data are presented as mean ± standard deviation of three biological replicates.

