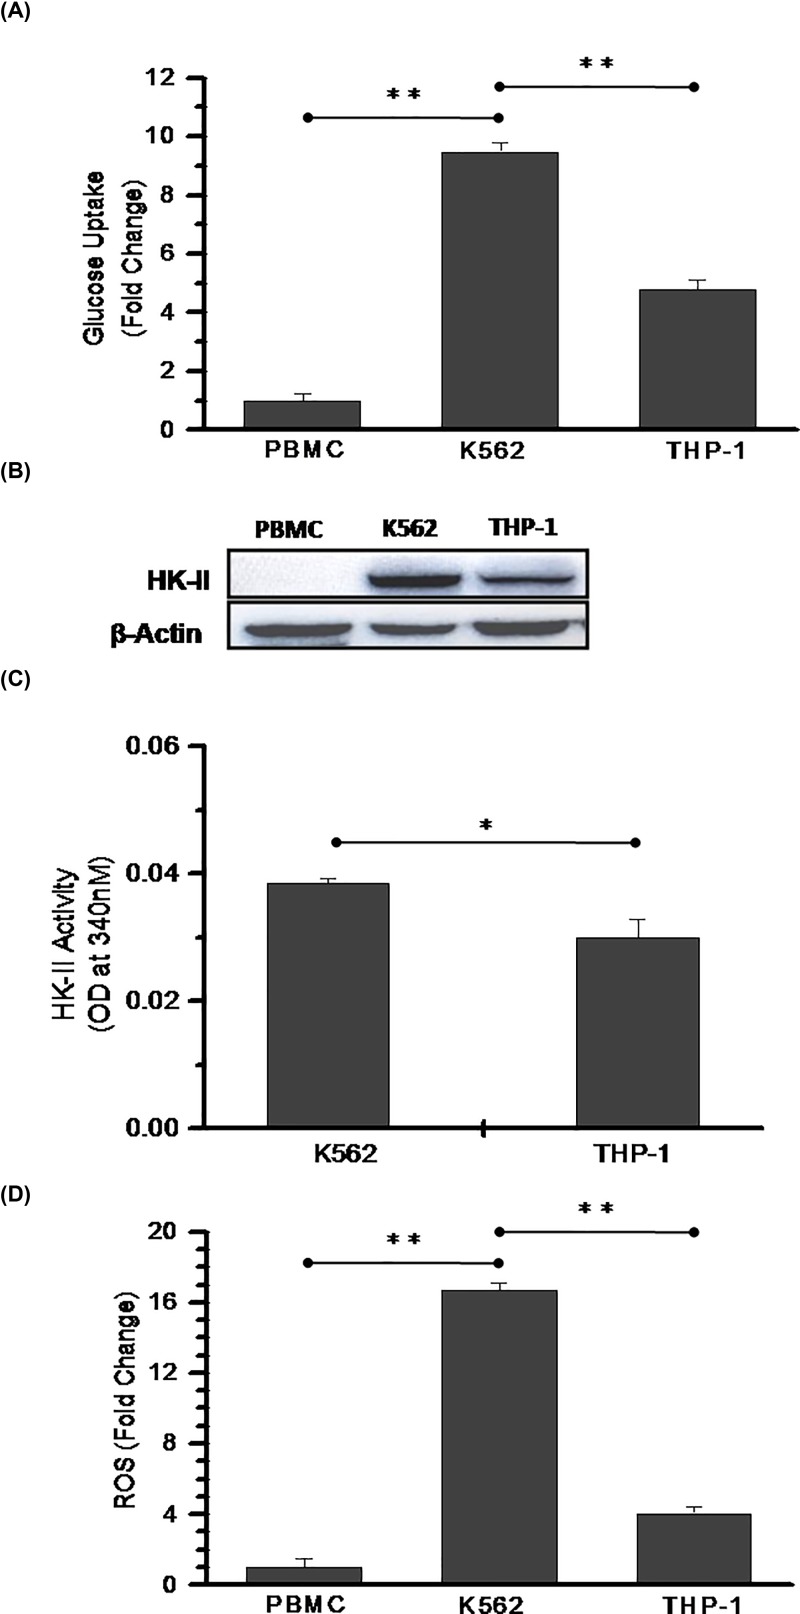
Figure 1. Increased HK-II activity promoted glycolytic phenotype in leukemic cells.
(A) Glucose uptake assay was performed using 2-NBDG in normal PBMCs and leukemic K-562 and THP-1 cells. Bar diagram represents fold change with respect to PBMCs. (B) Immunoblotting analysis for HK-II expression in the normal PBMCs, K-562 and THP-1 cells. (C) HK-II enzyme kinetics was performed in K-562 and THP-1 cells. Data presented here are NADP to NADPH conversion at 15 min (OD at 340 nm). (D) The endogenous ROS measured using H2-DCFDA and graph presented as relative fold change of PBMCs. Data are presented as mean ± SD (n=3) and statistical significance (*P<0.05; **P<0.01).

