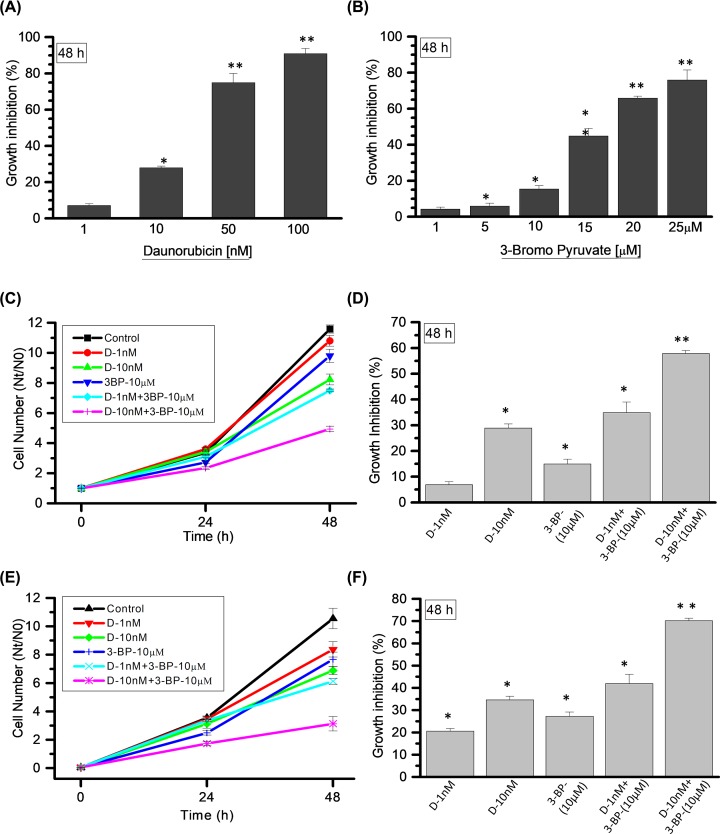
Figure 2. Combined treatment leads to synergistic effect on GI in myeloid cells.
(A) DNR and (B) 3-BP; post treatment cell numbers estimated at 48 h for the screening of different DNR and 3-BP concentrations (as mentioned in graph). Graph presented here as GI (%) compared with control in K-562 cells. (C) Cell number estimated using combination and TA as mentioned in graph at indicated time points in K-562 cells. (D) Treatment-induced GI quantified and presented at 48 h (derived from (C)). (E,F) Cell number and GI estimated and presented in THP-1 cells under similar experimental conditions used in K-562 cells. Data are presented as mean ± SD (n=4) and statistical significance (*P<0.05; **P<0.01).

