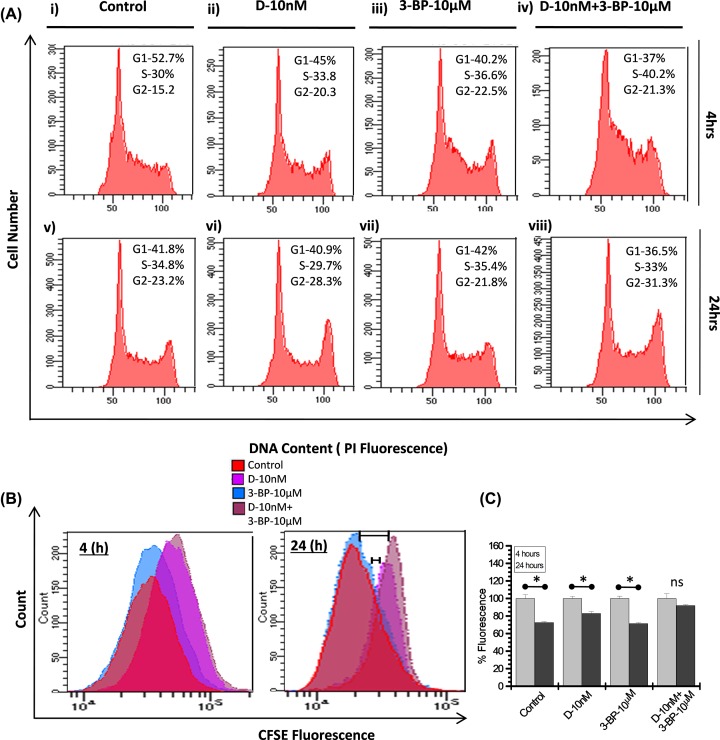
Figure 4. Combined treatment induced cell cycle arrest and inhibition of proliferation.
(A) Flow cytometric analysis of DNA content at indicated time points carried out in K-562 cells treated alone as well as combination of DNR (10 nM) and 3-BP (10 μM). Cell cycle percentage distribution of G1, S and G2-M populations are indicated. (B) Analysis of cell proliferation was carried out by CFSE labeling in K-562 cells. Overlay graph obtained and presented as treatment induced population shift at indicated time points. (C) Graph presented as CFSE fluorescence reduction (%) at indicated time points. Data expressed as mean ± SD (n=4) and statistical significance (*P<0.05), p = ns (no significance).

