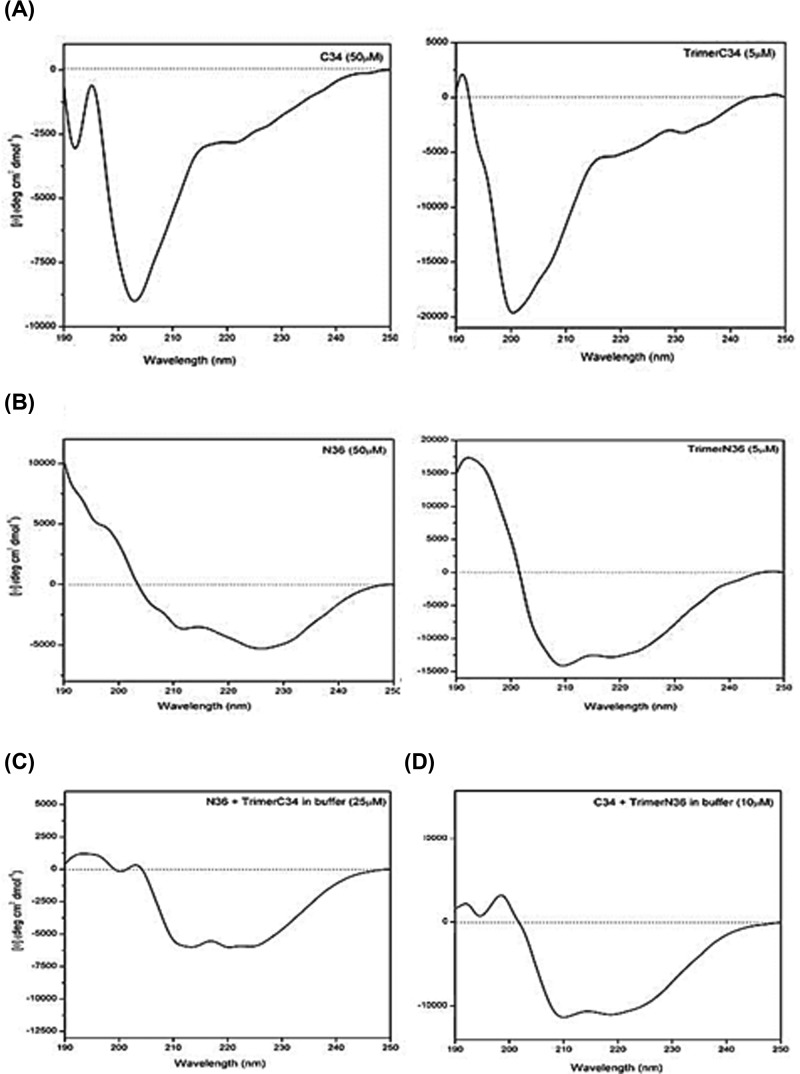
Figure 2. CD spectra of the various peptides and trimer–peptide complexes.
(A) CD spectra of C34 (left) and trimer C34 (right panel). (B) CD spectra of N36 (left panel) and trimer N36 (right). Peptides were used at 50 μM, and trimers at 5 μm in 10 mM sodium phosphate buffer pH 7.4, 50 mM potassium fluoride pH 7.4. (C,D) CD spectra of peptides in an equimolar mixture: monomer N36 + trimer C34 (C) and trimer N36 + monomer C34 (D). Spectra were obtained in aqueous solution. The apparition of a maximum at 192 nm and a double minimum at 208 and 222 nm were used as indicators of peptide interactions and of the formation of an α-helical structure.

