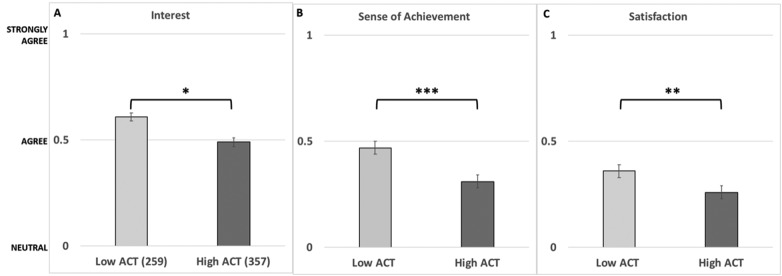
FIGURE 1.
Mean interest (A), sense of achievement (B), and course satisfaction (C) scaled scores by ACT bins (Low ACT = students who scored below the mean ACT score for survey participants across all three semesters; High ACT = students who scored above the mean ACT score for survey participants across all three semesters). Error bar is standard error of the mean for the survey item. (n = 616; *, p < 0.05; **, p < 0.01; ***, p < 0.001.)

