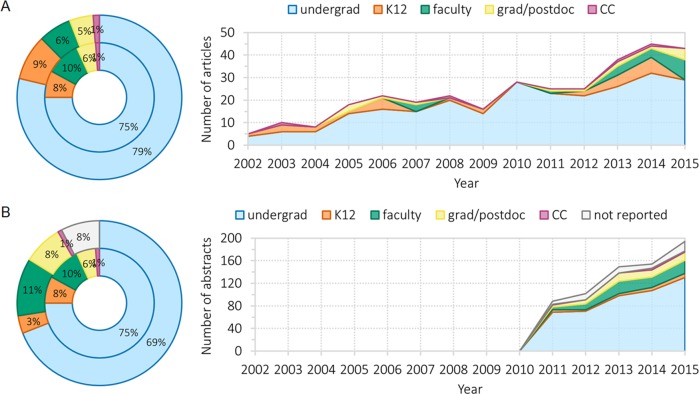
FIGURE 2.
Study context for LSE articles and SABER abstracts. (A) Study contexts found in LSE articles were coded as undergraduate, K–12, faculty, graduate student or postdoctoral scholars (grad/postdoc), community college (CC), or not reported. The rings on the left represent the complete LSE data from 2002 to 2015 (outer ring) and LSE data from 2011 to 2015 (inner ring) for comparison with the SABER data in the corresponding years. The graph on the right illustrates the percentage of studies with the particular study context found in LSE articles on an annual basis. (B) The same data are reported for SABER abstracts from 2011 to 2015. The rings on the left represents the 2011–2015 data for SABER abstracts (outer ring) and LSE articles (inner ring). The graph on the right illustrates the percentage of studies with the particular study context found in SABER abstracts on an annual basis.

