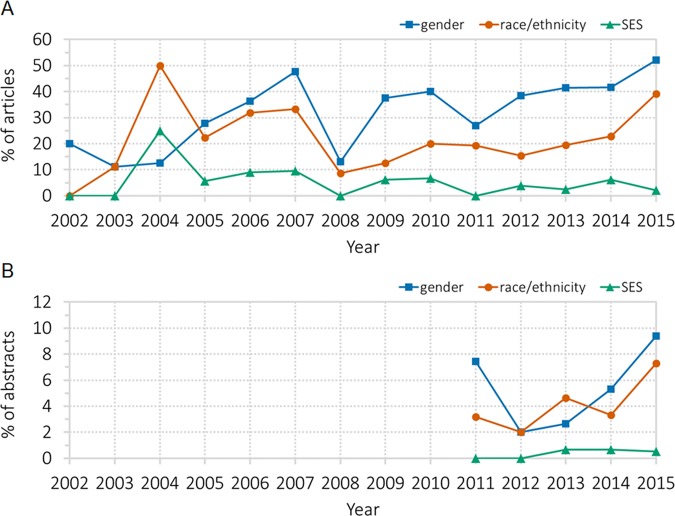
FIGURE 3.
Reporting of gender, race, and SES in LSE articles and SABER abstracts. (A) The percentage of LSE articles that include gender, race, and SES is presented on an annual basis from 2002 to 2015. (B) The percentage of SABER abstracts that include gender, race, and SES is presented on an annual basis from 2011 to 2015.

