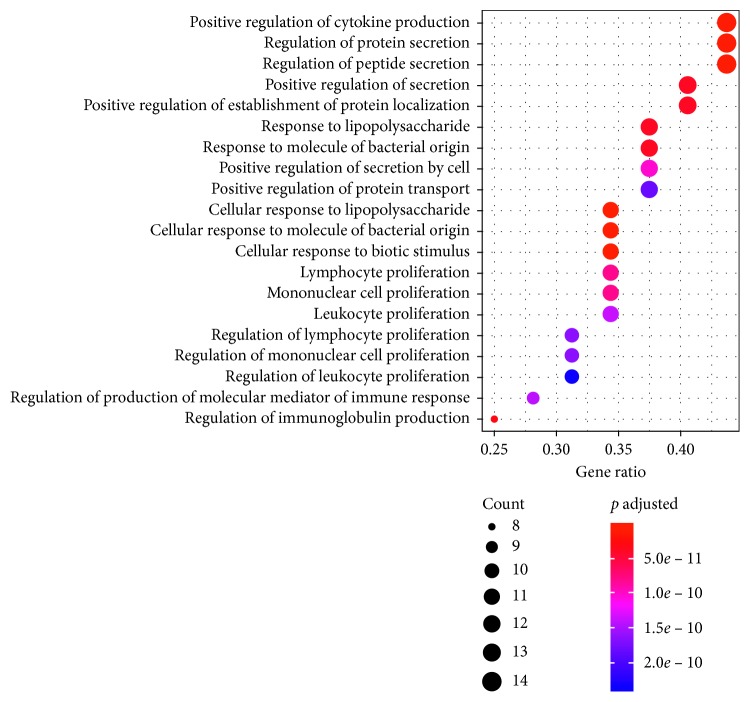
Figure 6.
GO BP enrichment analysis of the putative therapeutic targets of Xiang Ju tablets in the treatment of AR (p value <0.05; q value <0.01). The y-axis shows significantly enriched GO BP of the target genes, and the x-axis shows the gene ratio (the ratio of the number of target genes belonging to a pathway to the total number of annotated genes located in the pathway). A higher gene ratio represents a higher level of enrichment. Dot size indicates the number of target genes in the pathway, and dot color reflects the p adjusted range.

