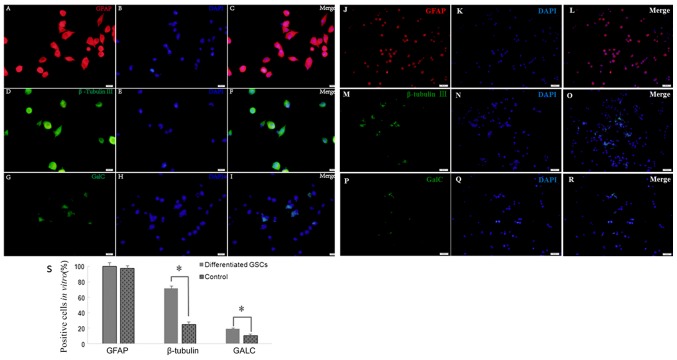
Figure 4.
Multipotency of neurosphere cell differentiation observed under a laser confocal scanning microscope. (A-I) Cells were stained for (A-C) GFAP (red), (D-F) β-tubulin III (green) and (G-I) GALC (green) after GSC differentiation. DAPI (blue) indicates nuclei. Scale bars, 20 µm. (J-R) GSCs were stained for (J-L) GFAP (red), (M-O) β-tubulin III (green) and (P-R) GALC as control. (S) Quantification of cells positively stained by each antibody. *P<0.05. Scale bars, 50 µm. GFAP, glial fibrillary acidic protein; GALC, galactosylceramidase.

