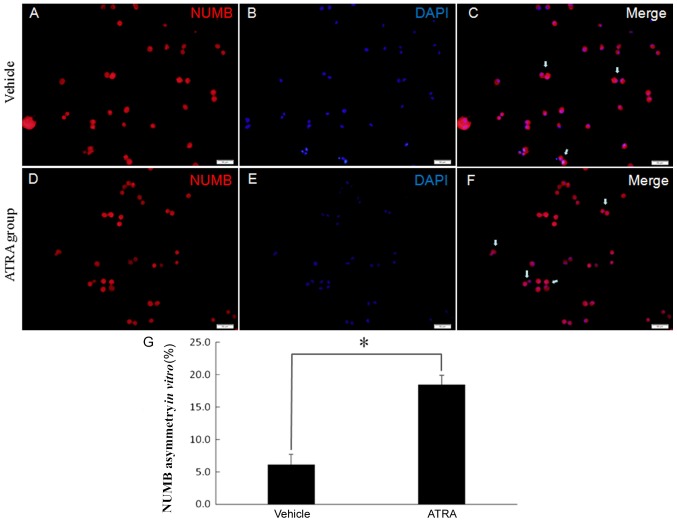
Figure 7.
ATRA induces asymmetric cell divisions of GSCs. (A-F) Numb (red) distribution was used to represent GSC division mode in (A-C) vehicle group and (D-F) ATRA group. Cells were counterstained with DAPI (blue) to mark nuclei. White arrows indicate asymmetric pairs. Scale bars, 50 µm. (G) Quantification of the asymmetric cell pairs demonstrated that treatment with ATRA increased the fraction of cell pairs with an asymmetric Numb distribution. *P<0.05. GSC, glioma stem cell; ATRA, all-trans retinoic acid.

