Figure 1.

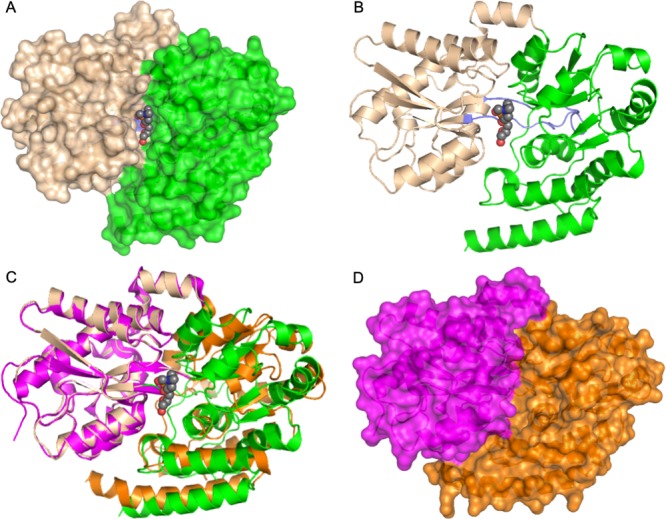
Crystal structure of Mtb UgpB. (A) Surface representation of Mtb UgpB in complex with GPC. The two domains are highlighted: domain I (brown) and domain II (green). The GPC ligand is represented as spheres with dark gray carbon atoms. (B) Cartoon representation of Mtb UgpB in complex with GPC identifying the secondary structure elements. Domain I (brown) and domain II (green). The two hinge regions are highlighted in blue. The GPC ligand is represented as spheres with dark gray carbon atoms. (C) Superposition of domain I of GPC Mtb UgpB cocomplex (brown/green) with domain I of apo-Mtb UgpB (PDB 4MFI) (magenta/orange). (D) Surface representation of the unliganded Mtb UgpB (PDB 4MFI) with the two domains colored magenta (domain I) and orange (domain II).
