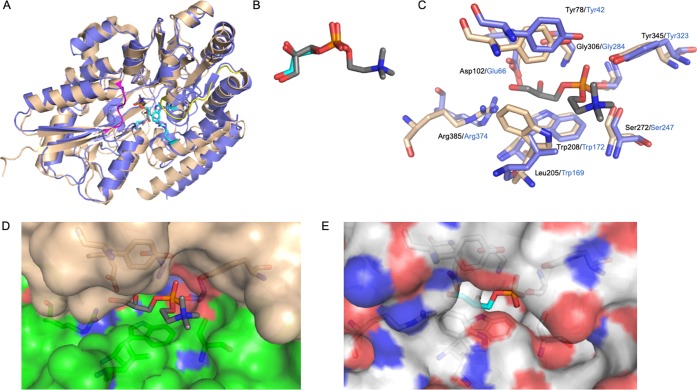
Figure 3.
Comparison of Mtb UgpB with E. coli UgpB. (A) Superposition of the Mtb UgpB GPC complex structure (blue) with E. coli UgpB in complex with G3P (PDB 4AQ4) (brown). Loop regions that differ are highlighted in yellow and magenta. (B) Close-up illustration showing the binding orientation of the GPC ligand and G3P ligand in stick representation (dark gray carbon atoms, GPC; cyan carbon atoms, G3P). (C) Close-up of the overlay of the binding sites of GPC (Mtb) and G3P (E. coli). Selected residues are shown as sticks (Mtb, blue; E. coli, brown), and the font is labeled in black (Mtb) and blue (E. coli). (D) Surface representation of the Mtb UgpB GPC binding pocket with the GPC ligand in stick representation. (E) Surface representation of the E. coli UgpB G3P binding pocket in the same orientation as D with the G3P ligand in stick representation.

