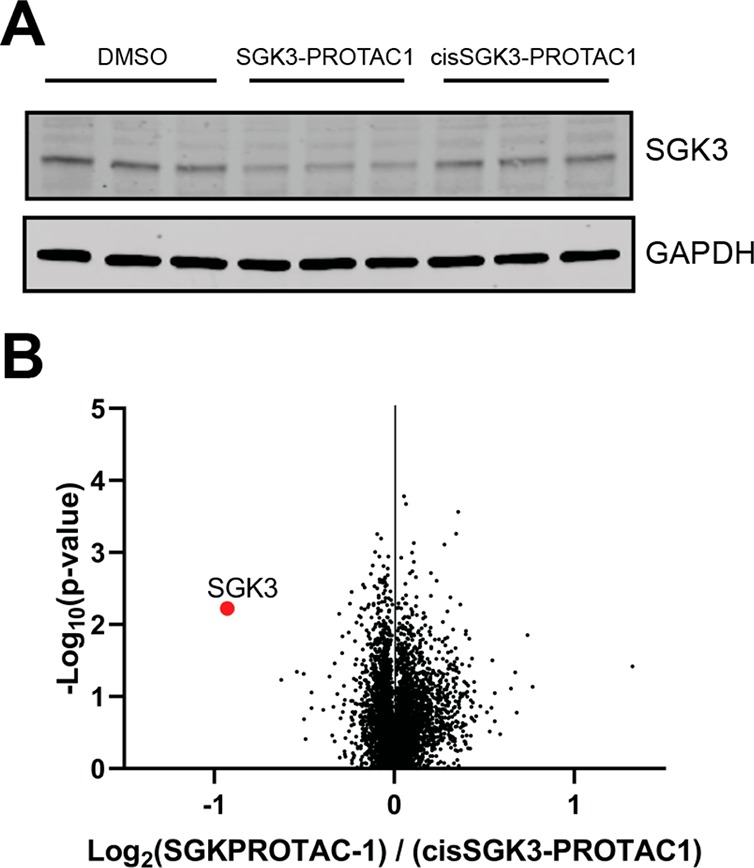
Figure 4.

TMT proteomic analysis of HEK293 cells treated with SGK3-PROTAC1. (A) Cells were treated with DMSO (control), SGK3-PROTAC1 (0.3 μM), or cisSGK3-PROTAC1 (0.3 μM) for 8 h and lysed. Lysates were subjected to immunoblot analysis with the indicated antibodies. (B) Lysates were examined by quantitative proteomics. Volcano plot demonstrating global proteomic changes induced by SGK3-PROTAC1 treatment versus cisSGK3-PROTAC1 in HEK23 cells.
