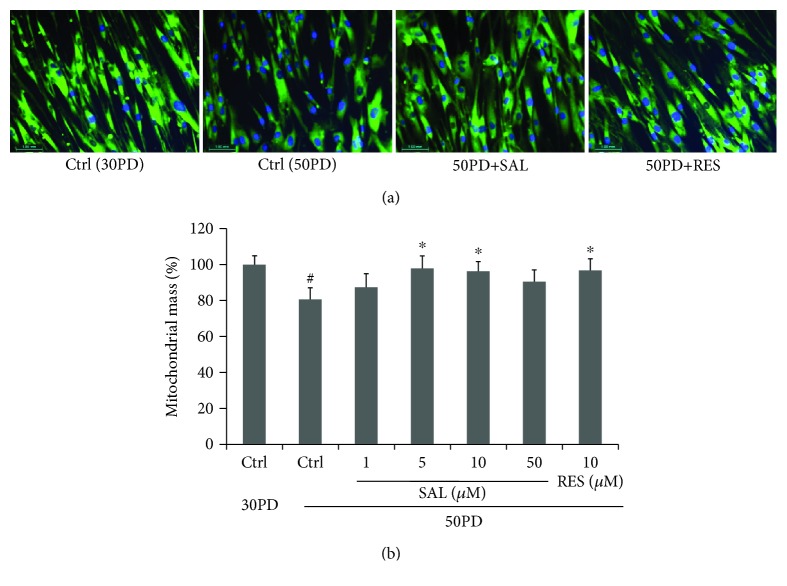
Figure 2.
Effect of salidroside (SAL) on a mitochondrial mass. (a) Mitochondrial staining in 2BS cells incubated with SAL (10 μM) or resveratrol (RES) at 10 μM for 48 h. NAO signal in cells was visualized by confocal microscopy. Images were acquired by using a ×20 objective. DNA was visualized by DAPI. Pictures were shown as merged by two paired images from NAO staining and DAPI staining, respectively. (b) Mitochondrial mass in cells cultured after 48 h with SAL at different concentrations was quantified by flow cytometry by using NAO as indicated in Materials and Methods. Data indicate the relative mean of the MFI (mean fluorescence intensity) from three different experiments performed in duplicate. #P < 0.05 versus 30PD control (Ctrl); ∗P < 0.05 versus control (Ctrl) at 50PD.

