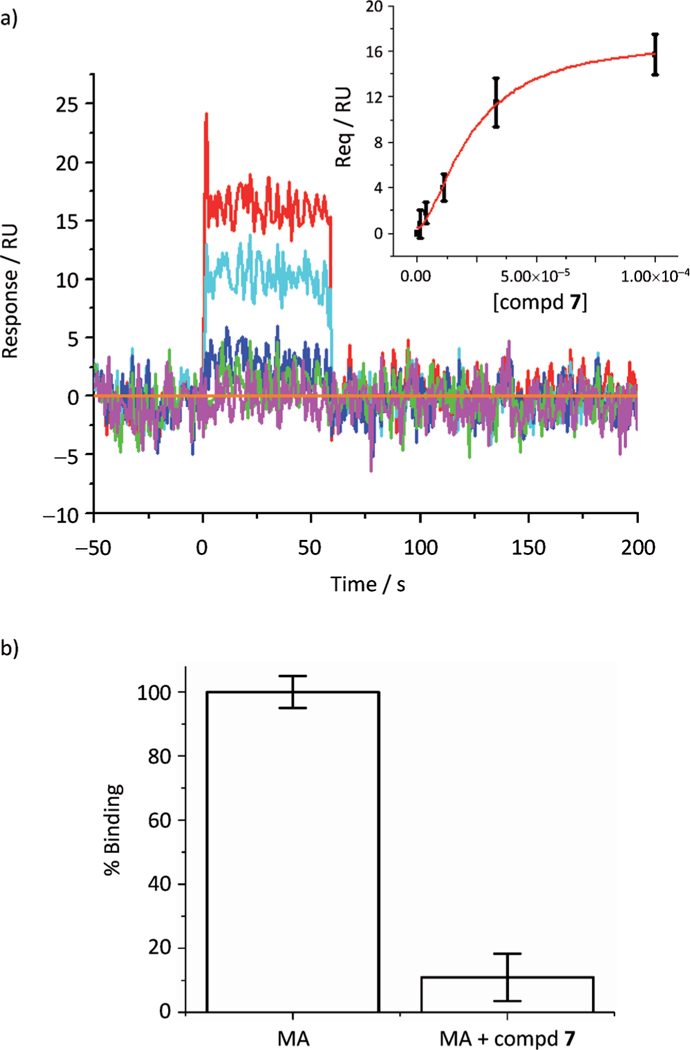
Figure 2.

a) Sensorgrams depicting the interaction of compound 7 with immobilized HIV-1|A| MA. Compound concentrations of 0, 6.25, 12.5, 25, 50, and 100 mM were tested and are represented as orange, magenta, green, blue, cyan and red lines, respectively. The insert shows the equilibrium plot used to derive the equilibrium dissociation constant (KD). Compound 7–MA interaction: KD = 22.6 (± 3.1) μM. b) Compound 7 competes with PI(4,5)P2 for binding to HIV-1 MA. MA protein (1 μM) in the presence or absence of compound 7 (75 μM) was passed over a PI(4,5)P2 surface, and the response was recorded. To allow comparison, the responses were normalized with respect to the degree of free MA.
