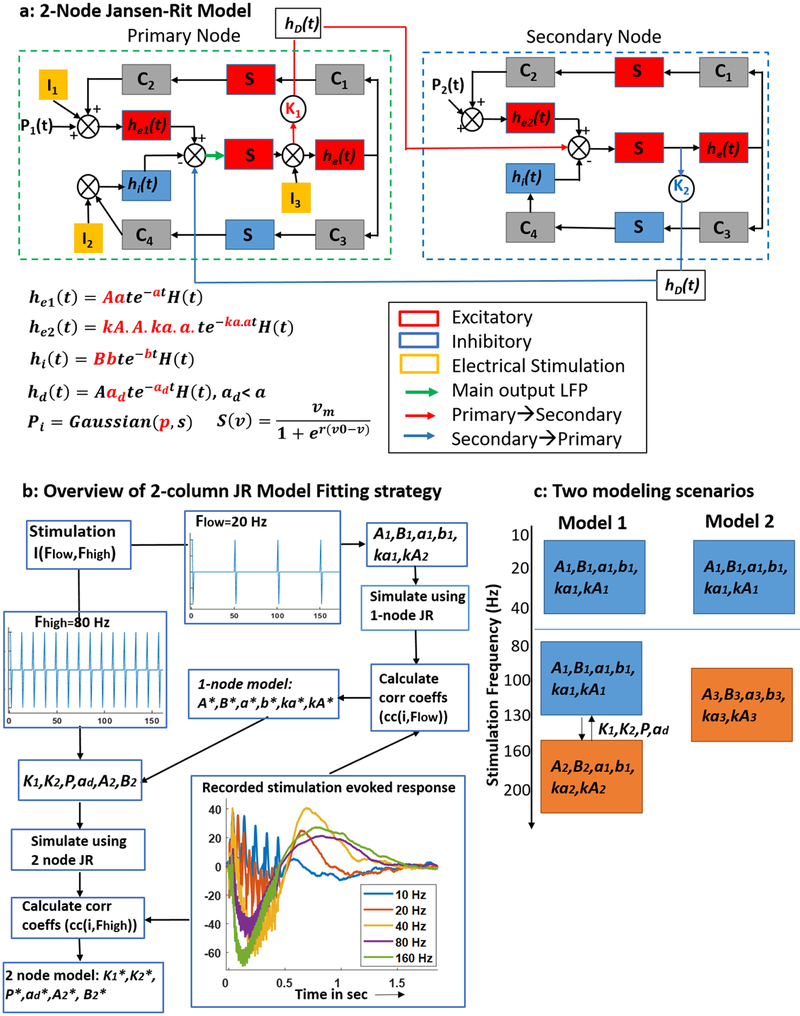
Figure 1.
Model schematic and method for identifying model parameters: (a) schematic of a 2-node JR model. Boxes represent neuronal populations and circles represent intra and inter population couplings. The parameters in red are the ones that were estimated. (b) A flowchart representation of the steps followed for model parameterization. The model parameters are described in table 1. The parameters with asterisks indicate those identified using recorded SER. Example SERs recorded from amygdala is also shown along with a reconstruction of the patient brain and electrode locations. (c) Two possible model paradigms: Model 1: 1-node JR model to simulate low frequency SERs and a second node added onto this to simulate high frequency SERs, Model 2: a combination of two 1-node JR models to simulate SERs in the low and high frequency stimulation regimes.

