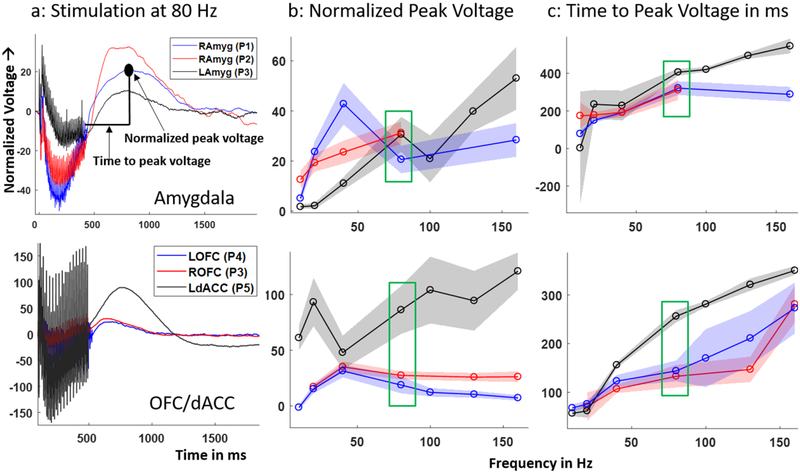
Figure 2.
Recorded SER trends across patients: (a) example 80 Hz SER normalized to pre-stimulation baseline in the six datasets recorded from N = 5 patients. Each SER (averaged over trials) was recorded in the amygdala (top) and OFC/dACC (bottom). (b) Variation of normalized peak voltage, (c) time to peak voltage over stimulation frequencies. The shaded error bars indicate 1 standard deviation calculated from 1000 surrogate SERs generated by resampling with replacement 5–10 recorded SER trials at each stimulation frequency and for each dataset. The coloring scheme for b and c are same as in a. The recorded SER corresponding to 80 Hz stimulation for all the datasets (boxed in green) are plotted in a. Note: P2 had SERs from 10–80 Hz.

