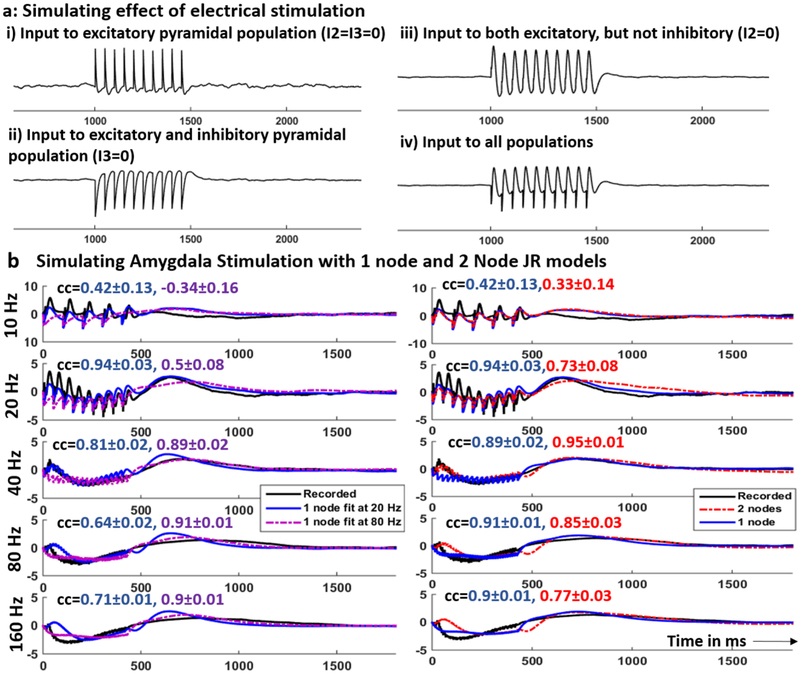
Figure 3.
Examples of recorded and simulated SERs in amygdala: (a) simulating the effect of stimulation on a 1-node JR model by adding input stimulation train to one, two or all three populations within a column. (b) Left: Recorded (black) and simulated SER using the 1-node JR models fit to 20 Hz (blue) and 80 Hz (purple) SERs in the amygdala. Right: Recorded (black) and simulated SER using 1-node JR model (blue) and that using the 2-node JR model (red). The blue SER is simulated using the 1-node model that produced a higher correlation coefficient. Each row in b corresponds to a different stimulation frequency as indicated on the y-axis. The correlation coefficients (mean ± 2 std dev) between the recorded and the simulated SER are shown in the same color as the corresponding plot.

