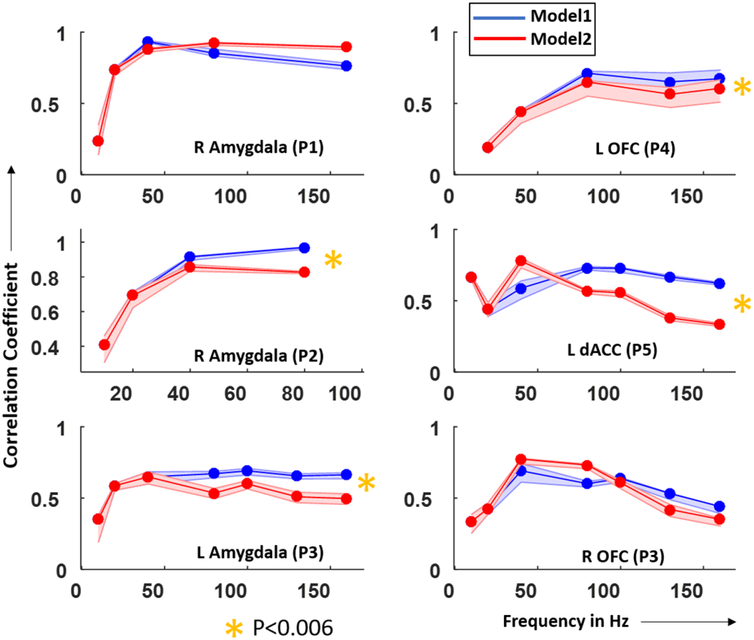
Figure 4.
The correlation between the human and model SERs tends to be highest for the 2-node model. Correlation coefficient between recorded and simulated SERs in the amygdala (left) and dACC/OFC (right) across subjects plotted over stimulation frequencies. SERs used to calculate the correlation coefficients were simulated using Model 1 (blue) and Model 2 (red). Yellow stars indicate the datasets for which Model 1 had significantly better fit (higher correlation coefficient) than Model 2 across stimulation frequencies greater than that where Models 1 and 2 were used (same 1-node model for lower frequencies). The p-value was determined based on empirical distributions generated by 1000 correlation coefficients calculated between surrogate SERs and simulated SERs averaged over frequencies. The p-value is corrected for multiple comparisons (N = 6 datasets) using Bonferroni correction. Note: amygdala (P2) did not have stimulation frequencies above 80 Hz as epileptiform activity appeared at 160 Hz.

