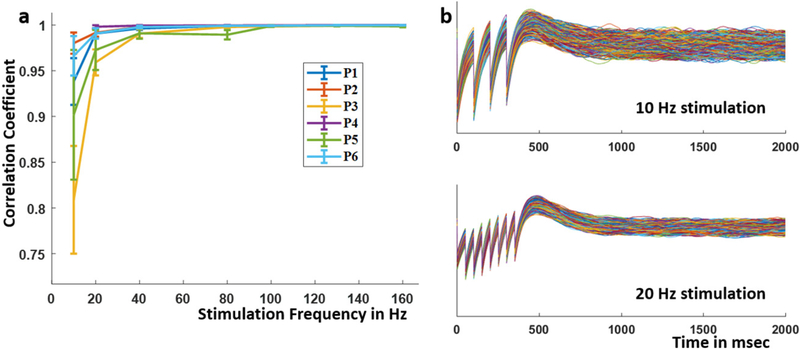
Figure 6.
(a) Mean and standard deviation of the correlation coefficient between simulated SER from the original fixed parameters and those simulated using perturbed fixed parameters across stimulation frequencies. Each fixed parameter was perturbed by 1%–5%. The different datasets are color-coded. (b) Example simulated SER using perturbed parameters for 10 Hz and 20 Hz stimulation.

