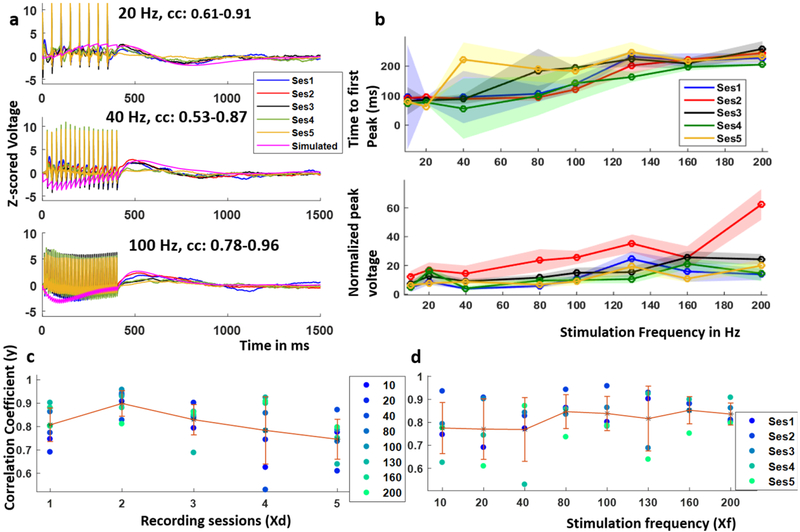
Figure 7.
The brain responds consistently to stimulation over one month. (a) Example SERs recorded in the mOFC with local stimulation at 4 mA and 10–200 Hz frequency over a period of 1 month and that simulated using a 2-node JR model which was parameterized using SERs recorded in the first session, the range of correlation coefficients between the recorded and simulated SERs across sessions included, (b) normalized peak voltage and time to peak voltage over the five recording sessions, (c) variation of the correlation coefficient between the recorded and simulated SER over recording sessions and that over stimulation frequencies.

