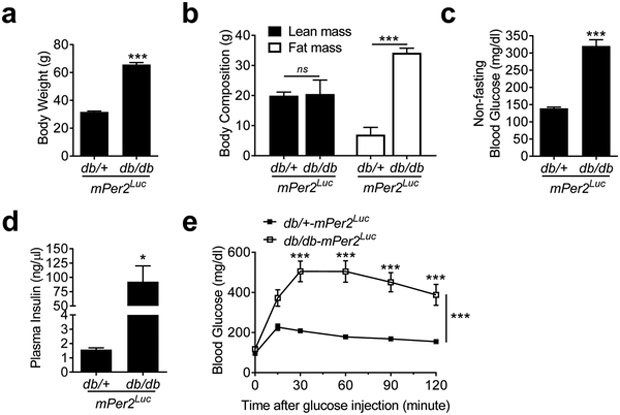
Fig. 1. The db/db-mPer2Luc mice are obese and diabetic.
Body weight (a; N = 12), body composition (b; N = 4-6), non-fasting blood glucose (c; N = 12), and plasma insulin (d; N = 4-5) were measured between ZT9 and ZT11 in the db/db-mPer2Luc and control db/+-mPer2Luc mice. Glucose tolerance test (e; N = 11-12) was performed at ZT3 after 6-hour fasting. All data were expressed as mean ± SEM. *, P < 0.05; ***, P < 0.001; ns, not significant.

