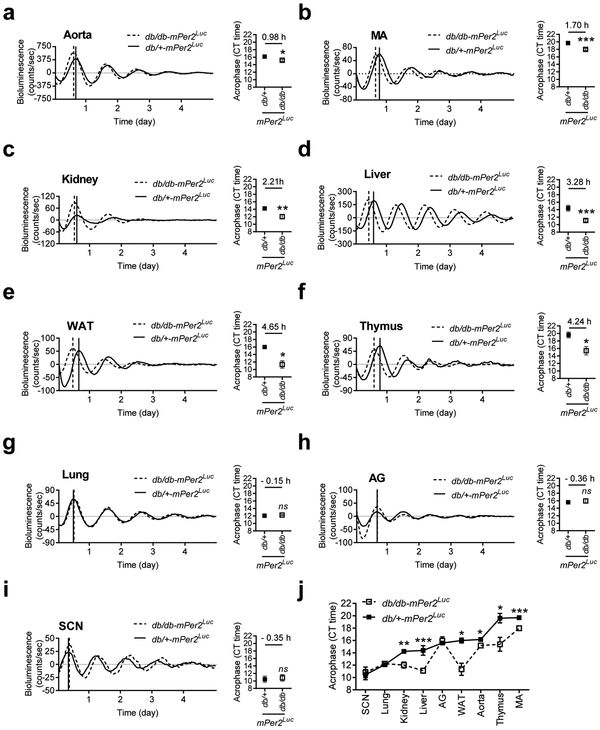
Fig. 5. The phases of mPer2 protein daily oscillation are desynchronized in various explanted peripheral tissues from the db/db-mPer2Luc mice.
The bioluminescence of mPer2 protein daily oscillation was recorded by LumiCycle in explanted central SCN and peripheral tissues from the db/db-mPer2Luc and control db/+-mPer2Luc mice. The mPer2 oscillation acrophase of the tissues was calculated using the LumiCycle analysis software. In the representative mPer2 bioluminescence real-time recording (left panel), the solid vertical line indicates the acrophase of the non-diabetic db/+-mPer2Luc control mice, whereas the dotted vertical line indicates the acrophase of the diabetic db/db-mPer2Luc mice. In the acrophase (right panel), the number above the symbol indicates the difference of the acrophase between two strains of mice. All data were expressed as mean ± SEM from the aorta (a; N = 7-11), mesentery artery (MA; b; N = 8-12), kidney (c; N = 4-5), liver (d; N = 6-12), white fat tissue (WAT; e; N = 3-4), thymus (f; N = 3-5), lung (g; N = 4-6), adrenal gland (h; N = 3-6), and suprachiasmatic nucleus (I; SCN; N = 6-11). *, P < 0.05; **, P < 0.01, ***, P < 0.001; ns, not significant.

