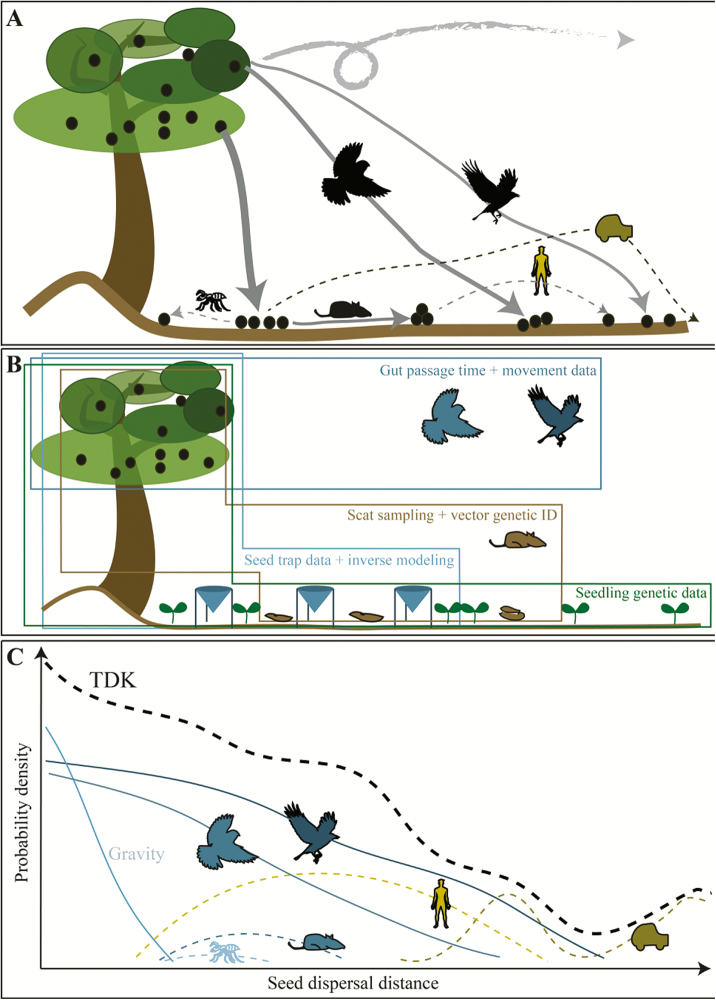
Figure 1.
Seed dispersal of one plant species by different vectors (A), methods to assess seed dispersal (B) and the TDK resulting from seed dispersal kernels of different vectors (C). (A) Seeds from a plant can be dispersed naturally by different biotic and abiotic vectors, resulting in varying densities of seeds transported over varying distances. This can include higher-order dispersal, where already dispersed seeds are moved by a subsequent dispersal vector (e.g. scatter-hoarding rodents). Human-mediated dispersal (e.g. by hikers or vehicles) can contribute to seed dispersal, but dispersal distances become more unpredictable since the vector’s travel distances cannot be inferred from its biology alone. The size of icons and thickness of arrows correlate with the number of dispersed seeds—the larger the icon, the more seeds the vector disperses. Different lengths of arrows symbolize varying dispersal distances. (B) Seed trap data combined with inverse modelling incorporates all aerial vectors but does not allow identification of individual vectors and often ignores secondary seed dispersal. Scat sampling with genetic identification allows identification of individual vectors but ignores gravity and secondary dispersal. Both methods may underestimate long-distance dispersal unless genetic approaches are used to match seeds to adult plants across larger areas. Gut-passage time combined with movement data, or tracking of individual seeds from a source plant, can characterize where mobile vectors or wind move seeds but ignore other vectors (e.g. gravity, ants). These three broad approaches need to be combined with seed fate-focused studies to understand seed dispersal effectiveness. Methods that combine genetic data of established seedlings to adult plants can be used to characterize the total effective dispersal kernel (at least to the seedling stage), but do not allow vector identification. Ultimately, a combination of methods will lead to the best representation of the TDK, but also bring challenges associated with integrating different types of data. (C) Conceptualized TDK, including the seed dispersal kernels of all potential dispersal vectors for a given plant species/population. The contribution of each dispersal vector to the TDK depends on its importance, i.e. how many seeds it disperses and how far. Solid lines represent dispersal kernels of vectors where there is empirical evidence for the kernel shape and their contribution to the TDK can be calculated. Dashed lines represent dispersal kernels that have so far rarely been described or studied and their contribution to the TDK is unknown (for example secondary dispersal or human-mediated dispersal), increasing the uncertainty of TDK calculations and illustrating the need for more empirical studies on neglected dispersal vectors. The black dashed line represents the TDK based on all dispersal vector contributions, where contributions of primary vectors are summed and multiplied for secondary vectors. The probabilities densities are scaled such that the area under the TDK is one.

