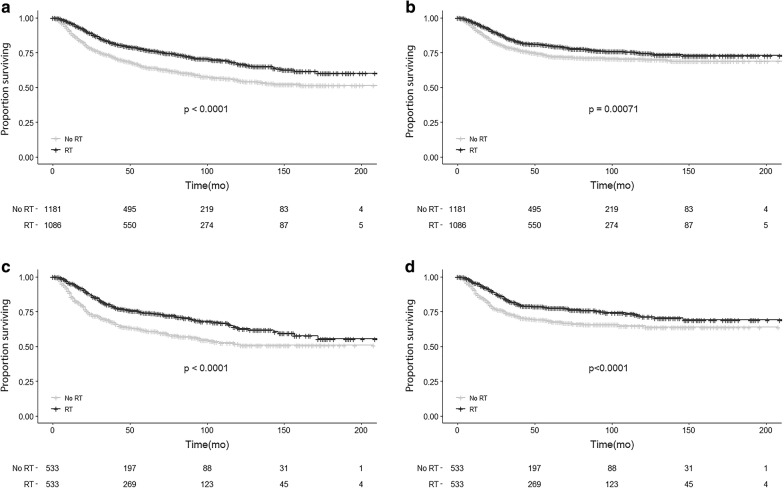
Fig. 2.
OS and BCSS of MBC patients displayed as Kaplan–Meier curve stratified according to RT. a OS curves of RT cohort versus no RT cohort before PSM. b BCSS curves of RT cohort versus No RT cohort before PSM. c OS curves of RT cohort versus no RT cohort after PSM. d BCSS curves of RT cohort versus No RT cohort after PSM

