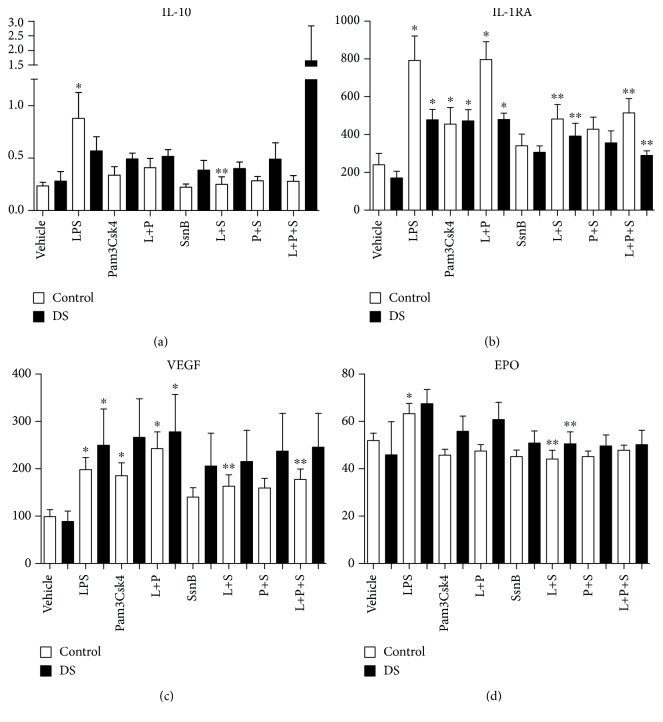
Figure 6.
Cytokine levels of IL-10, IL-1RA, VEGF, and EPO in response to LPS (L), Pam3Csk4 (P), and SsnB (S) in children with Down syndrome (DS, n = 7) and controls (n = 7). Values expressed as pg/mL or in logarithmic scale equivalent. ∗p < 0.05 vs. vehicle in the respective cohort. ∗∗p < 0.05 vs. respective treatment.

