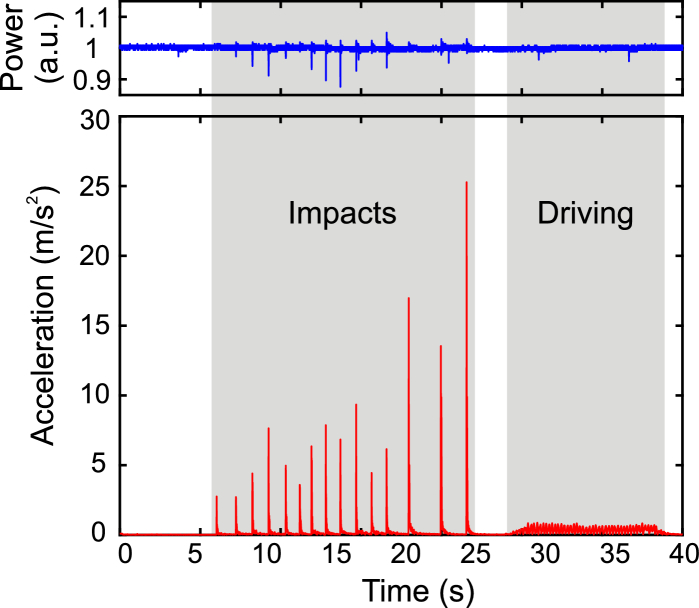
Fig. 5.
Results of the stress test of the light source placed on a laboratory cart. Lower panel shows the acceleration applied to the cart, grouped into impacts onto the cart and vibrations due to movements of the cart. Upper panel shows the simultaneously measured output signal power of the light source.

